[[updated October 7, 2016]]
Analyzing Instagram performance is key to any successful Instagram strategy. Without Instagram analytics in hand, you have no way of understanding how you’re doing and how to improve. Keep your eye focused on these metrics to make sure your Insta game is strong.
1. Follower growth rate
Like other social media channels, the number of Instagram followers isn’t the be all and end all metric. But the rate in which Instagram users follow your account is often indicative of what you’re doing (or not doing) on this platform.
See if you can tie that rate to a rise or fall in your posting frequency, the amount of interactions on other users’ posts, a promotion requiring a follow, or the quality of photos and short videos you uploaded during this time period.
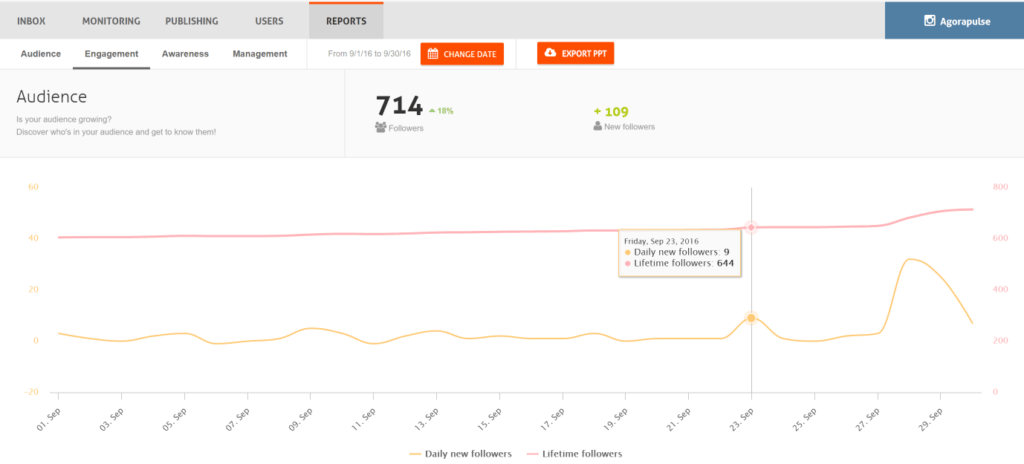
In my Agorapulse Instagram report, I noticed that I had one of two spikes in September on the 23rd. Guess it’s time for me to go back to my feed and see what I posted that day!
You can also calculate the percentage of monthly growth.
First get the number of followers at the first of the month and the end of the month.
For September, I started with 605 followers. I ended the month with 714.
Take the number at the end of the month and subtract the number at the beginning of the month from it.
714 – 605 = 109
Then divide that number by the number of followers at the beginning of the month.
109 ÷ 605 = .18 <– That’s my percentage of follower growth in September — 18 percent.
Related Post: Instagram 101
2. Engagement as a percentage of total followers
Once your Instagram follower base has grown to a comfortable level, you’ll want to measure engagement — Instagram likes and comments — against your current followers count. (OK, so here the number of fans is more important than the growth rate!)
Here, I used my Agorapulse report to tell me how many likes and comments my account of 714 followers has received over the past month.

(Yes, Instagram analytics are included in all Agorapulse plans!)
I can then take this average number of likes and comments and divide it by my 714 followers. That will be my engagement percentage per total followers.
137 + 10 = 147
147 ÷ 714 = 20.5 % <– That’s my engagement percentage of my total followers.
Could my comments have increased because I was strategic in asking questions of my followers? (Could my comments have dipped because I didn’t ask good Instagram questions?) Figure out how the rate here compares with last month or the last six months as a whole.
Do note that both followers and non-followers can like and comment on your posts. However, this percentage of follower data point is still a relatively good indicator of how you’re doing with your Instagram content.
3. Engagement per post
Let me use the above chart to determine the number of likes or comments per post. Those six posts earned 137 likes and 10 comments. Combine those two numbers and divide it by six (the number of my posts) — there’s my average engagement per post.
137 + 10 = 147
147 ÷ 6 = 24.5 <– That’s my engagement per post.
If my prior six posts had a much higher or lower number, I’d analyze why that might be the case.
4. Clickthroughs on URLs
This Instagram metric is both easy and a real pain to follow. The only tappable URL you can share with Instagram users is the link you put in your Instagram bio.
See how this country singer Tegan Maria literally points out where her tappable URL is? She knows that it’s her best shot of getting traffic to her download page.
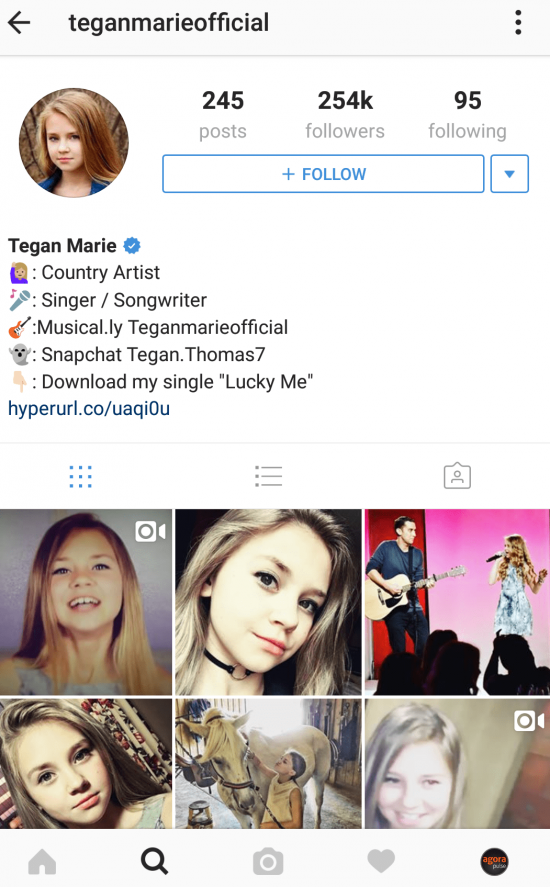
The good news is that this URL is the only one you’re able to track — so less work for you!
The bad news is that Google Analytics is wonky when it comes to tracking referral traffic from Instagram. Your other option is to use a bit.ly link so that you can more easily determine how many Instagram users have come to your Web destination.
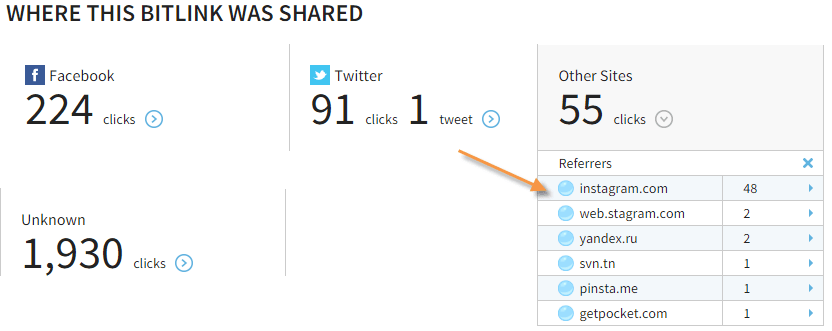
This bit.ly link was shared across various social channels, including Instagram.
5. Growth of hashtags
The monitoring tab of the Agorapulse dashboard is a great way to track hashtag promotions. In the example below, I followed #ilooklikeanengineer.
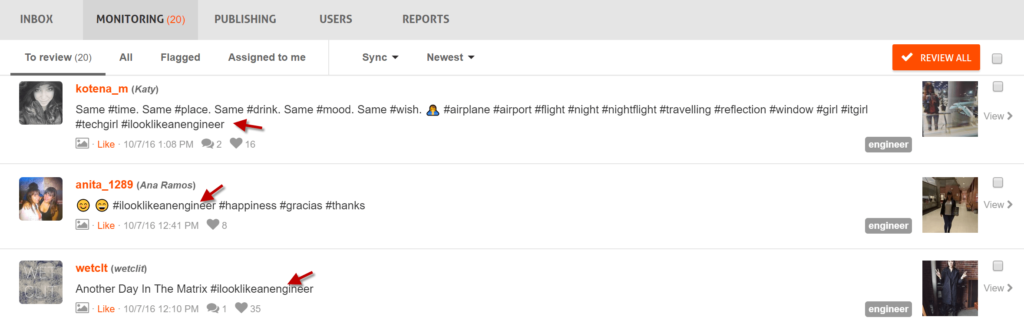
If I want to determine the growth over the course of the campaign, I simply scroll down and count how times #ilooklikeanengineer was used during that time.
Despite your best efforts to use a branded hashtag (like #ilooklikeanengineer), you should also monitor your brand name as a hashtag. Instagram users make such hashtags with or without your prompting! So look for #yourbrandname, especially if you are interested in gathering user generated content.
Data from both branded and brand name hashtag campaigns should be analyzed at least monthly.
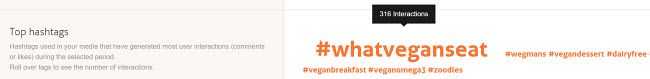
6. Top hashtags by interaction
If you’re inserting hashtags in your posts, have you seen them have an impact on likes or comments? If so, which hashtags seemed to encourage the most engagement?
Another peek at my Instagram report from Agorapulse and I can see which hashtag is grabbing me the most interaction on my account.
7. Growth of competitors’ hashtags
If you’re using branded hashtags, your competitors probably are too. Check their bios on at least a monthly basis to see if they’re prompting users to use a particular tag. Then check something like Tagboard to see how many posts they’ve earned.
Is there something you can learn from these results?
What other metrics do you monitor when you conduct Instagram analysis? Let me know in the comments!