

Twitter is still a robust and powerful traffic-driving platform. After all, 321 million active users are currently on the social media platform. 500 million tweets are sent per day!
Twitter reports engagement with ads on Twitter has increased 50% year over year, as of Q3 2018. Twitter also reports a 14% year over year decline in cost-per-engagement on Twitter ads.
When I think of social media ads I don’t think of Twitter, I tend to immediately think of Facebook or Instagram. But, seeing as there are this many users and this many ads that thinking needs to change.
Twitter’s ad system is quite robust and offers a few options depending on your objectives.
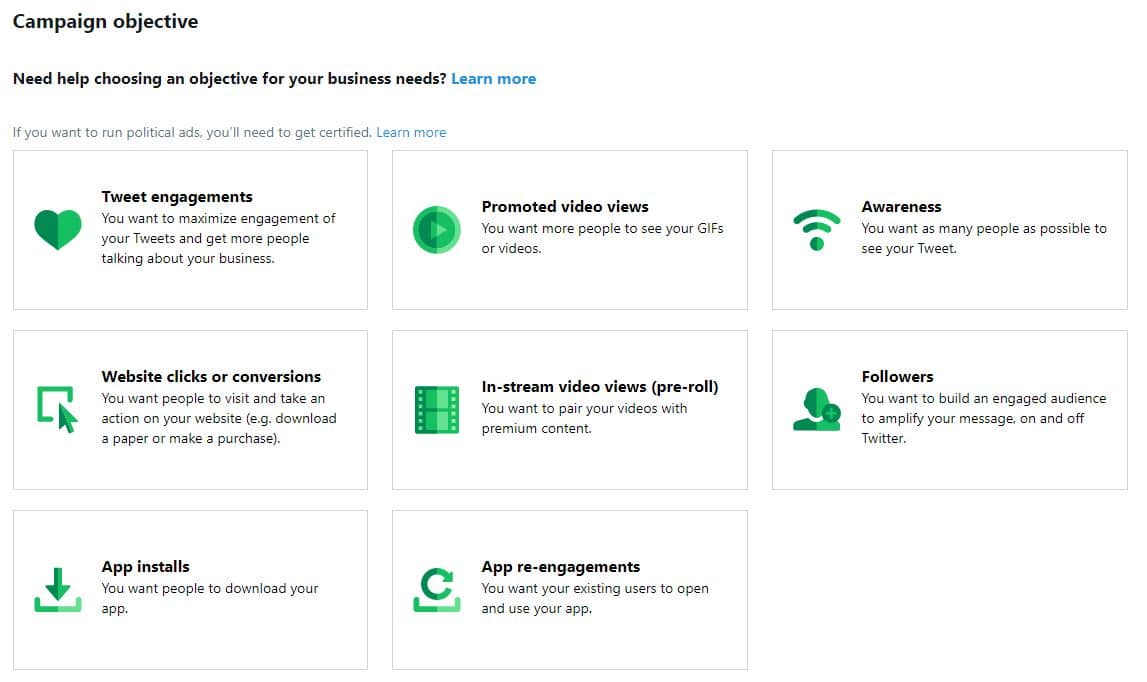
The Social Media Lab wants to test a few of these objectives and compare the results.
We will take a look at Tweet Engagements, Awareness, and Website clicks or conversions.
The goal is to see which ad objective is most effective to promote a link to a webinar registration.
SHARE THIS EXPERIMENT!Click To TweetClicks will be our most important factor because we need to drive traffic to get signups.
Hypothesis: The Websites clicks or conversion objective on Twitter ads results in the most link clicks.
Testing Twitter Ad Objectives
*You can watch our Social Media Lab LIVE show covering this test below:
This test was conducted on the Agorapulse Twitter account.
The ad was a tweet regarding an upcoming webinar.

We chose 3 different objectives for the test:
- Awareness

- Website clicks or conversions

- Tweet engagements

The budget was set at $500 USD for the campaign, split evenly among the 3 ad objectives. The Twitter ad had a start date of June 19th, and an end date of June 24th.
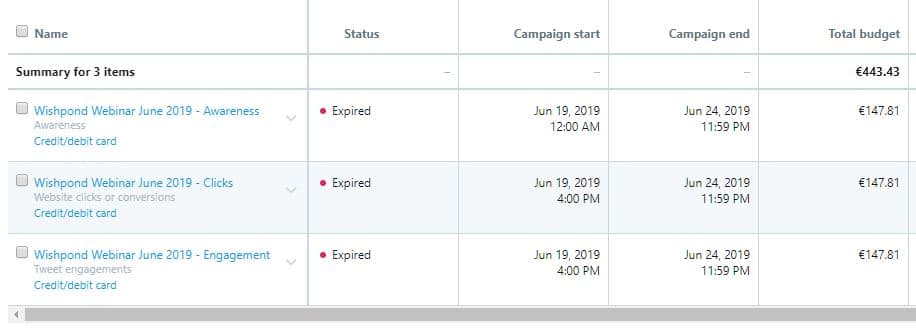
The screenshots in this post will show our budget and ad spend in Euros.
We are a French-based company and the Twitter account has been set as being in Paris. So although the ad was set up by our social media manager, who is in the US, Twitter converts to Euros. At the time, the ad was set up $500 USD was equivalent to €443.43.
Each objective had identical settings:
- Standard pacing
- Automatic bidding (Twitter optimizes for the best price for you)
- Target any gender or age
- Ad spend spread equally per day at €29
What are the results?
Twitter Ad Objective Results
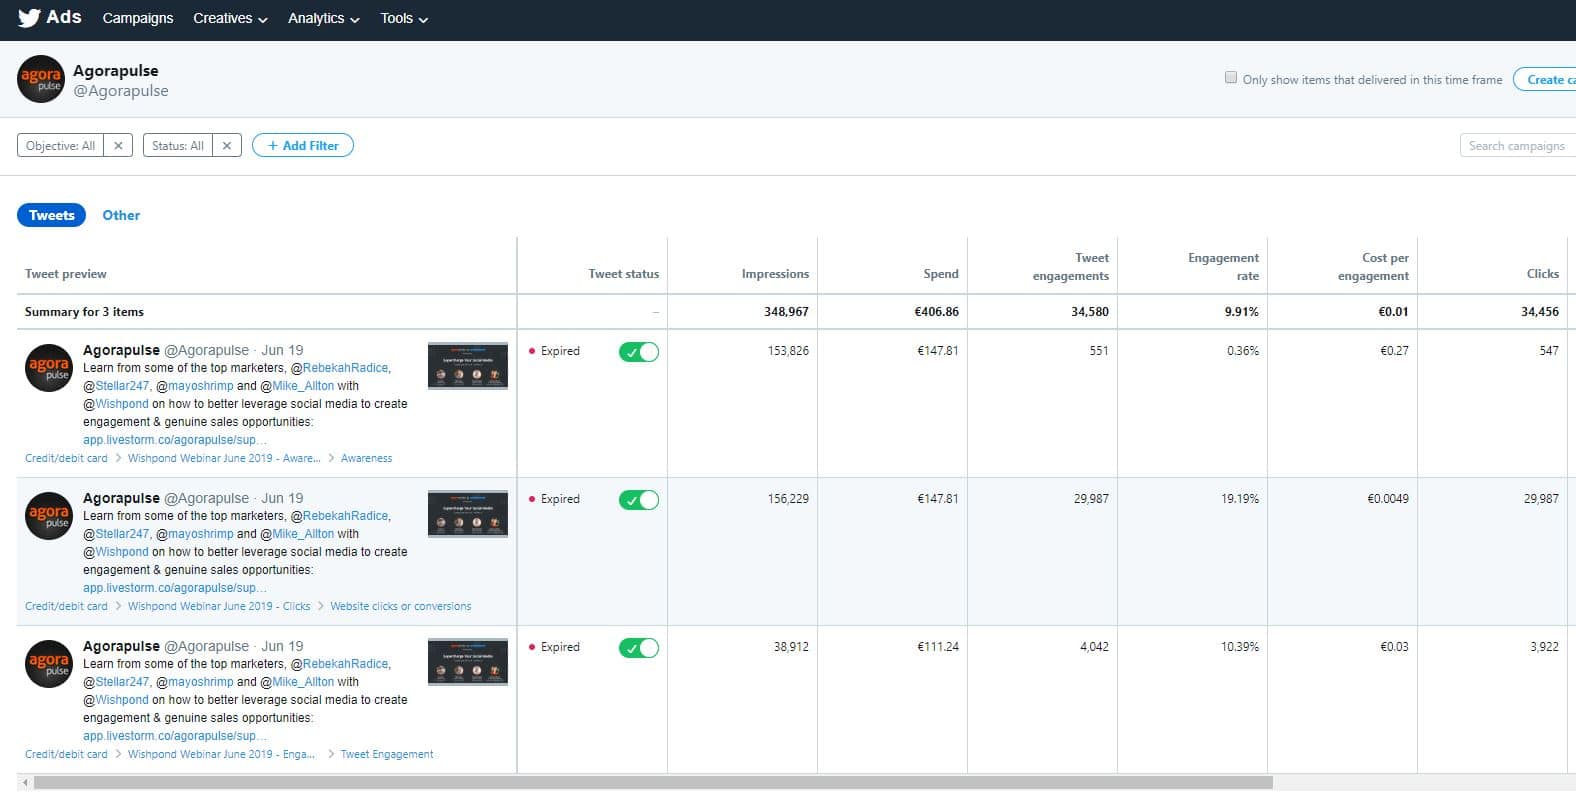
Below you’ll see a screenshot of the campaign and each ad objective.
Take a look at it then let’s breakdown the pieces of it to see what we found.
The first thing you may notice is the Tweet Engagement objective has a different ad spend than the others.
Twitter doesn’t give us a reason for this, but it seems the ad ended before the full amount was spent. We will need to factor this difference in expense for evaluation purposes.
The difference equates to a decrease of 24.74% in money spent compared to each of the other campaigns individually. We shall see whether that makes any difference in our conclusion.
Let’s break down each Twitter Ad objective.
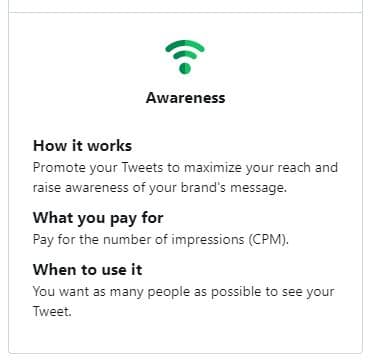
- Awareness: The goal was to get as many people as possible to see the tweet.
- Ad spend: €147.81
- Impressions: 153,826
- Tweet engagements: 551
- Clicks: 547
- Engagement rate: 0.36%
- Retweets: 1
- Replies: 0
- Follows: 3
- Cost per engagement: €0.27
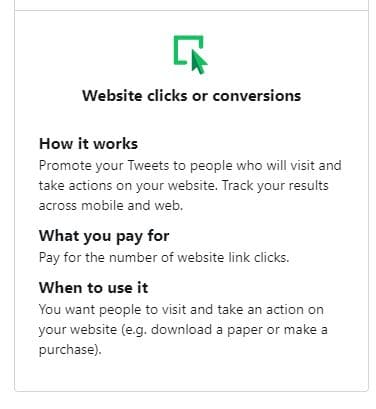
- Website clicks or conversions: The goal with this objective is to get link clicks.
- Ad spend: €147.81
- Impressions: 156,229
- Tweet engagements: 29,987
- Clicks: 29,987
- Engagement rate: 19.19%
- Retweets: 0
- Replies: 0
- Follows: 0
- Cost per engagement: €0.0049
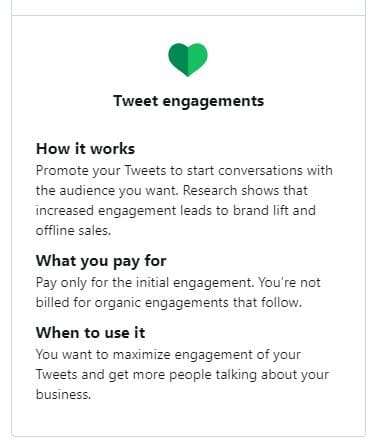
- Tweet Engagements: The goal is to maximize engagement and get people talking about your business.
- Ad Spend: €111.24
- Impressions: 38,912
- Tweet engagements: 4,042
- Clicks: 3,922
- Engagement rate: 10.39%
- Retweets: 83
- Replies: 9
- Follows: 13
- Cost per engagement: €0.03
Evaluating Twitter Ad Objective Data
Each of these ad objectives had different goals in mind, as shown in the screenshots earlier.
It’s a mystery to me how Twitter accomplishes these goals. How do they get more clicks on 1 objective than another? Especially as it’s all the same tweet.
Regardless of how we evaluate the data, it’s easy to see the Website clicks or conversions objective garnered the most clicks.
Clicks:
- Awareness: 547
- Website clicks or conversions: 29,987
- Tweet Engagements: 3,922
Combining the 2 smaller objectives together we see that Website clicks or conversions had 571% more clicks!
Website clicks or conversions also had more Impressions than the other individual objectives and an impressive 19.19% Engagement Rate.
Hands down the Website clicks or conversions objective wins—right?
Maybe not, and let me tell you why.
When ads are set up on Twitter, you have the option to allow them to be shown on the Twitter Audience Platform. So, your ad can show up inside mobile apps. (Think of apps like Candy Crush that are ad-supported.)
Some of these apps simply make you see the ad or click on the ad so the app gets paid, and the person playing the game can continue on at no cost to them.
This means our ad probably showed up on lots of apps that may or may not have been applicable to our ad directing people to sign up for our webinar.
This puts a wrinkle in our findings.
Looking at the screenshot below you’ll notice all of the results from the Website clicks or conversions objective were on the Twitter Audience Platform.
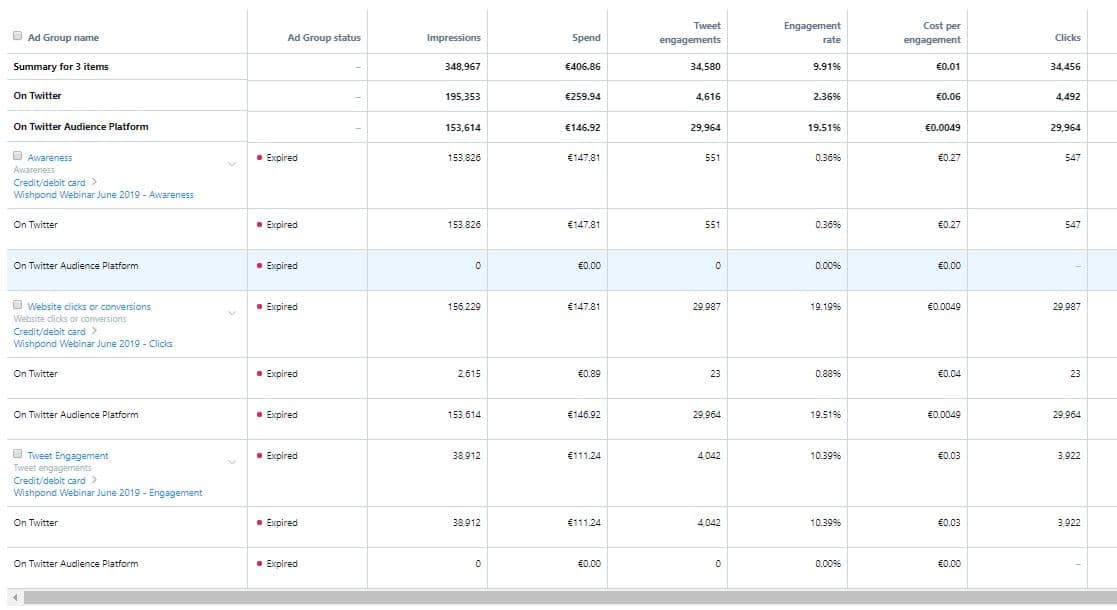
You’ll also notice the other 2 objectives had 0 engagements of any kind on the platform, as they aren’t aimed at getting clicks primarily.
With this knowledge in hand, I’m compelled to say the Website clicks or conversions objective did not perform better after all.
These clicks were very low quality, registrations would have been much higher if these clicks were of value.
The Tweet engagement objective produced more qualified clicks, as well as more retweets, follows, and replies than the other objectives. This was accomplished with fewer Impressions and a lower ad spend (remember this objective spent about 25% less than the other objectives).
If we were to run this test again, I’d suggest not allowing the ads to show on the Twitter Audience Platform and would target more by region, interests, and age.
In the end, our $500 spent on Twitter ads didn’t give us the results we had hoped, but it did teach us — and hopefully you — a lesson on how to better use the Twitter Ad platform.


