

Subscribe to the Social Media Lab Podcast via iTunes | Stitcher | Spotify
Should You Focus on Facebook Mobile Ads or Desktop Ads?
For quite some time, the usage of social media has moved to a mobile experience. Apps, such as Snapchat, Instagram, and TikTok are only fully available via mobile devices.
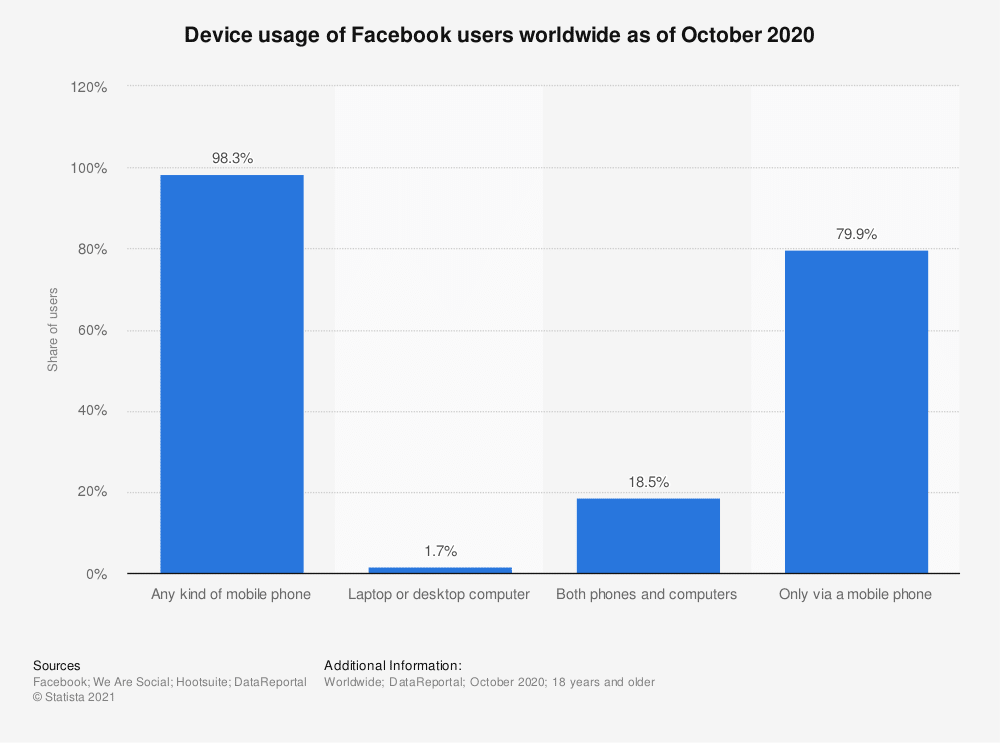
A whopping 79% of Facebook users only access Facebook via mobile devices, according to Statista. At least 98% of all Facebook users use Facebook on some sort of mobile device each month.
Marketers (and I) still run our Facebook ads on desktop as well as mobile. But are Facebook mobile ads better than desktop ads?
Should we only run our Facebook ads on mobile moving forward?
In today’s Social Media Lab experiment we’ll test Facebook mobile ads vs desktop to see which one performs better.
Statista found only 1.9% of Facebook users are desktop-only users, with 19% of Facebook users accessing via both phones and computers.
According to SingleGrain 93% of Facebook’s ad revenue is from mobile ads. This data leads SingleGrain to conclude “forget desktop if you’re a marketer — mobile-first is the way to go.”
Based on the large percentage of mobile-only users and the amount of revenue Facebook receives from mobile ads my hypothesis will favor Facebook mobile ads.
Hypothesis: Facebook mobile ads have a lower CPC and result in more link clicks than desktop ads.
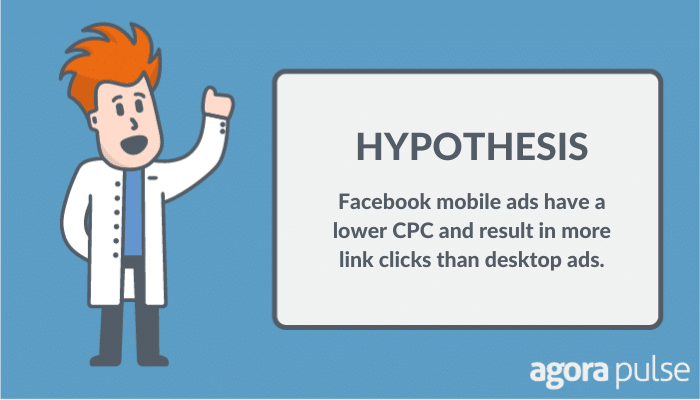
I’m basing my hypothesis on the large percentage of mobile-only users and the amount of revenue Facebook receives from mobile ads.
How We Tested Facebook Mobile Ads vs Desktop Ads
Using the Facebook Ads Manager, we ran a split test in January directing traffic to a blog post on the Social Media Lab, then ran another split test directing traffic to a different blog post in February.
Ad Budget
We spent $1,000 on the ad in January as well as February, totaling $2,000 for this experiment.
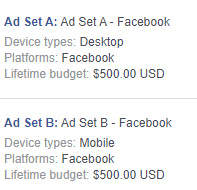
Facebook evenly split this budget between desktop and mobile placements (giving us $1,000 spent on mobile ads as well as $1,000 spent on desktop ads).
Ad Objective and Split Test
We chose the traffic objective for our ads.
Facebook has this to say about the traffic objective:
-
Send people to a destination such as a website, app or Messenger conversation (Website Clicks)
-
Increase the number of people going to your mobile or desktop app (App Engagement)”
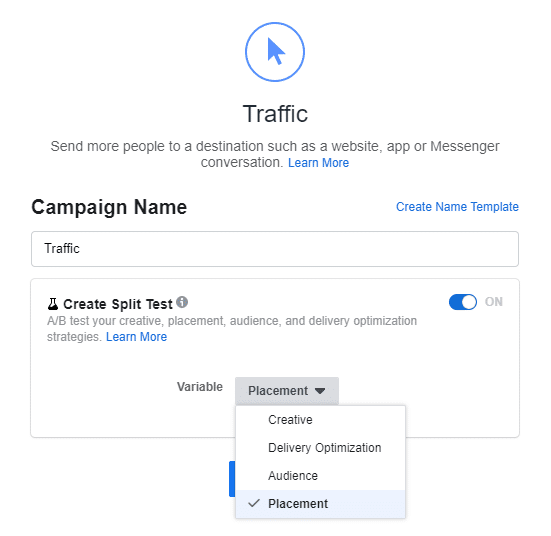
Facebook Ads Manager allows advertisers to split test ad placement. For this test, I simply chose the “placement” option. During the ad set-up process, I then specified what placements I wanted.
The ad placements were desktop and mobile, the desktop ad was restricted to the news feed only (no ads in stories, sidebar, messenger, etc)
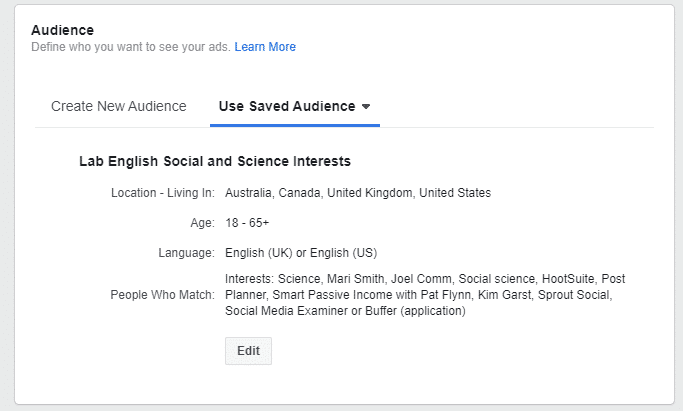
Ad Target
Our ads targeted English speaking Facebook users only who reside in:
- Australia
- Canada
- United Kingdom
- United States
We left the age restrictions open to including anyone over 18, seeing as our blog post isn’t a product that only appeals to a certain age.
Targeting interests helps our ad to be seen primarily by Facebook users who should be interested in our social media marketing content. I say “should” because some might follow some of these interests for business or motivational tips instead of social media marketing tips, as well as a broad interest such as science.
The interests we targeted were:
- Science (This audience is perhaps outside our primary target, but due to the scientific nature of our blog it shouldn’t be too disruptive.)
- Mari Smith
- Joel Comm
- Social science
- Hootsuite
- Post Planner
- Smart Passive Income with Pat Flynn
- Kim Garst
- Sprout Social
- Social Media Examiner
- Buffer
These interests are a mix of social media marketing influencers as well as some of our competitors at Agorapulse.
The Ads
This ad for mobile and desktop ran in January directing traffic to an experiment on using text on Instagram image posts.


You’ll notice the ads are almost identical, with a few exceptions:
- The text on the mobile ad was hidden under “See more” due to space restrictions on mobile posts
- The desktop ad included the first line of text from the post as the description “Subscribe to the Social Medial Lab…” Why Facebook did this I’m not certain.
This mobile and desktop ad used in February sending traffic to a study comparing the CPC of Facebook and Twitter ads:

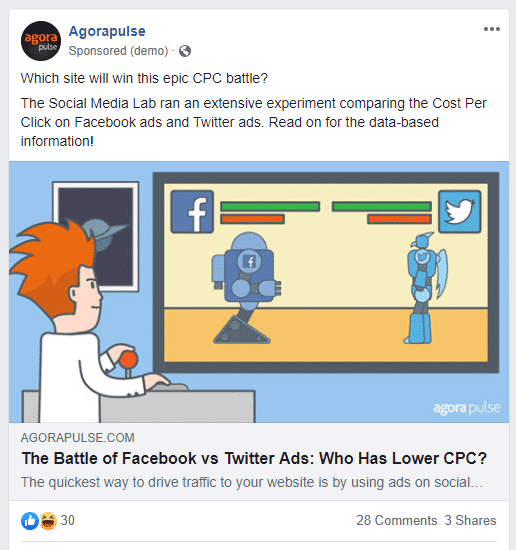
Just as with the January ad on mobile, the text reached the limits in the update and caused the “See more” link. The desktop ad once again pulled in the first line of text from the article.

Data Points To Collect
We will look at many data points to get a detailed picture of how the ads performed on both mobile and desktop:
- Link Clicks
- Reach
- Impressions
- CPC
- CTR
- Unique Link Clicks
- Landing Page Views
- Cost per Landing Page View
- Clicks (All)
- CTR (All)
- Comments
- Reactions
- Shares
Why all of these data points?
I want us to have a clear picture of how the ads performed. I’m personally guilty at times of only looking at CPC because the ads I’m running are to drive traffic and not conversions (I’m not selling a product or asking for free signups, just looking for blog post views.)
But if we leave out some of these data points, we may be coming to incorrect conclusions. And Facebook Ads Manager could be misleading your conclusions, or at worse the numbers you or I might be using for Facebook Ads Reporting.
By default, Facebook Ads Manager will show you the Link Clicks results when you choose “Traffic” as your objective. But is this the right metric to look at?
Take a look at Facebook’s definition of a link click:
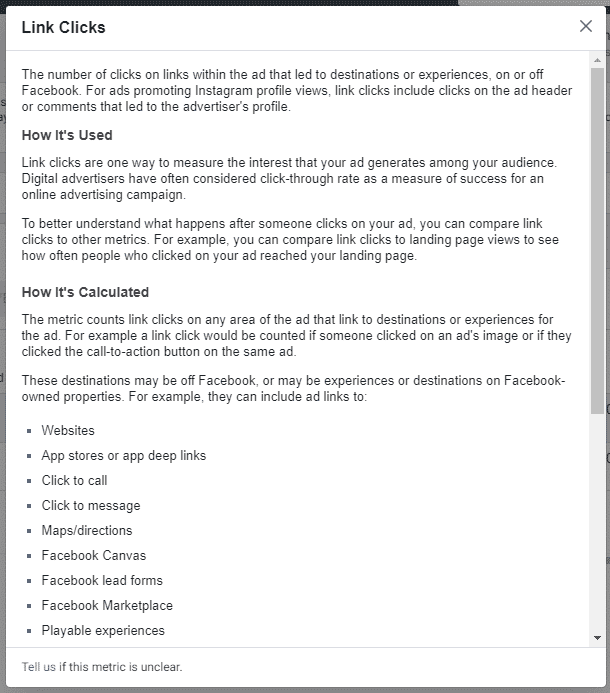
The “Link Clicks” data point is not just counting clicks on your links; this data point counts clicks in comments, clicks on the image, etc. The person may have simply clicked on your profile link, or read the comments, and may have never gone to your website.
Unique Link Clicks is a data point that is likely a better data point to base conclusions of ad performance on.
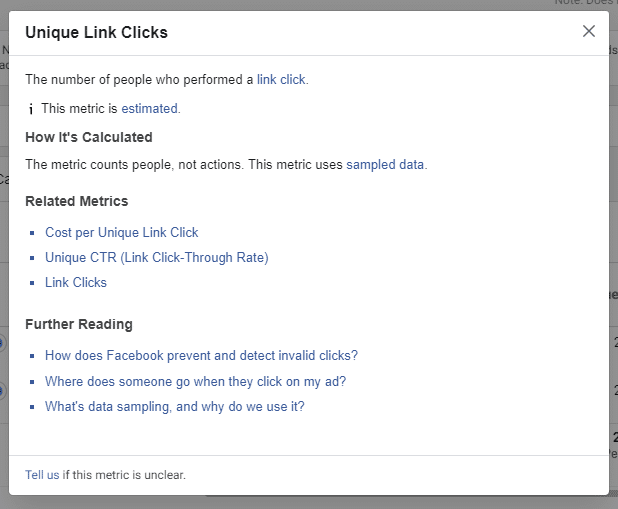
This number tells you how many unique users on Facebook click on the ad. “Link Clicks” could be including a user clicking on the ad 10 times.
But even the “Unique Link Clicks” could be falling short of 100% solid data.
Landing Page Views may be the better stat to look at when evaluating ads that are purely for driving traffic.
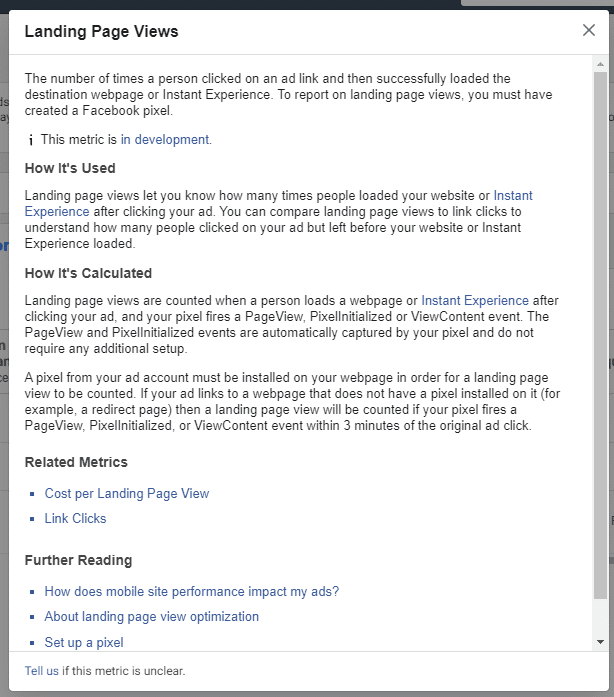
The “Landing Page Views” data only counts when the user clicks on the link and lets the website load. You’ll need a Facebook Pixel installed, and in our case, we have it setup.
Based on this information, “Landing Page Views” sounds like the most important stat to take into consideration when evaluating which ad drives the least expensive traffic. Looking at just “Link Clicks” could mean some of the Facebook users never click the actual link.
We are including the social interaction data to gain insight on where users might engage with the content more. This isn’t the goal of the test but it’s an interesting piece of data to compare.
The Results of Testing Facebook Mobile Ads vs Desktop Ads
Here’s the raw data after averaging the two mobile ads together and two desktop ads together.
Facebook Desktop Ads:
- Link Clicks – 542.50
- Reach – 36,924
- Impressions – 79,846
- CPC – $0.94
- CTR – 0.68%
- Unique Link Clicks – 497.50
- Landing Page Views – 180
- Cost per Landing Page View – $2.79
- Clicks (All) – 599
- CTR (All) – 0.75%
- Comments – 9
- Reactions – 28.50
- Shares – 2
Facebook Mobile Ads:
- Link Clicks – 937
- Reach – 64,792
- Impressions – 103,253
- CPC – $0.67
- CTR – 0.88%
- Unique Link Clicks – 913.50
- Landing Page Views – 595.50
- Cost per Landing Page View – $1.83
- Clicks (All) – 3462.50
- CTR (All) – 3.05%
- Comments – 5
- Reactions – 9
- Shares – 1
Facebook mobile ads outperformed on every data category except the social engagement numbers, based on our study. Raw numbers are hard to compare, so look at the percentage differences favoring mobile ads.
- Link Clicks – 72.72% higher
- Reach – 75.47% higher
- Impressions – 29.32% higher
- CPC – 28.27% lower
- CTR – 29.41% higher
- Unique Link Clicks – 83.62% higher
- Landing Page Views – 230.83% higher
- Cost per Landing Page View – 34.29% lower
- Clicks (All) – 478.05% higher
- CTR (All) – 306.67% higher
- Comments – 44.44% lower
- Reactions – 68.42% lower
- Shares – 50% lower
Facebook Mobile Ads Are Definitely Better Than Desktop Ads
Based on the data from this Social Media Lab test, we can conclude that Facebook mobile ads outperform desktop ads when driving traffic to a blog post.
Facebook mobile ads achieved more link clicks, more landing page views, lower CPC and lower cost per landing page view. The list goes on and on.
There was less engagement on the mobile ads, which isn’t too surprising since the mobile nature of social media tends to be a quicker, less engaging experience (at least for me). The engagement wasn’t our goal on the ads, but it does add value to the ads when others start engaging.
As more and more Facebook users become mobile-only, it would be wise to primarily focus on mobile ads. Desktop ads shouldn’t be completely eliminated, as there is lots of ad inventory there, but based on our data it doesn’t perform as well.
Keep in mind our ad experiment wasn’t driving users to a sales page, lead magnet page or anything that was intended for conversions. This is purely a test for awareness and drives traffic. Your results could be different depending on your product.


