

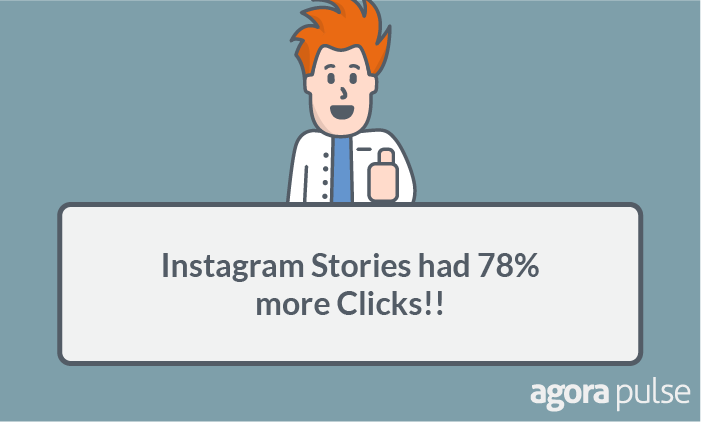
Instagram Stories have been all the rage this past year.
So we ran a test comparing ads on Stories vs the feed and found that Stories outperformed the feed. And Stories especially excelled when it came to clicks:
I recently encountered a great study by our friends at Quintly on how to analyze Instagram Stories. And it got me wondering. Is there any way we can discover which type of Instagram Story gets the most attention from our followers?
I conducted an exhaustive web search looking for the answer to this question. But, alas, all I could find were articles describing best practices and tips on how to create Stories. Don’t get me wrong, these articles are useful, but don’t really help a marketer make decisions on what to post to these pesky Instagram Stories.
At the Internet Summit conference Carlos Gil made a declaration about Stories that further gives me reason to test Stories more:
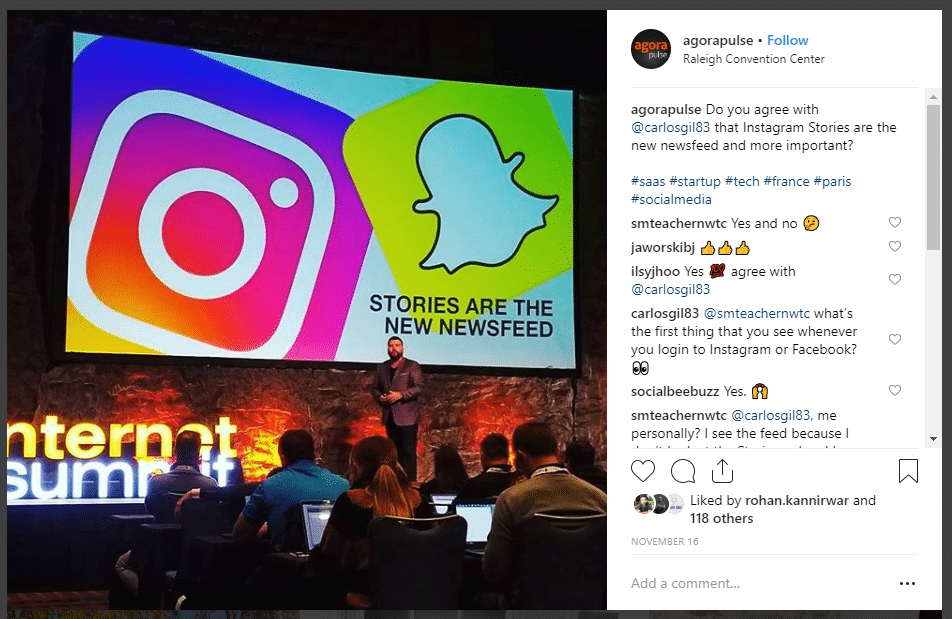
If Stories are now more important than the newsfeed we as marketers better figure out the best ways to leverage them.
So naturally, here at the Lab, we decided to run a test! In this case, to see if Stories with video perform the best.
Hypothesis

Testing Instagram Stories
Before we move on to the test, a quick word of caution.
Instagram makes it REALLY tough to get useful data on Instagram Stories. Stories expire in 24 hours and the corresponding insights for these Stories also vanish in this time frame. So for a test such as this I had to be certain to grab a screenshot of the insights around the 23-24 hour mark or it they would be lost forever.
Maybe some day Instagram will give us historical data on Stories but in the meantime, I’m happy to let you know that Quintly has figured out a way to keep that data!!
Stories Types
There are a lot of different things that can be tested in Instagram Stories. Things such as polls, questions, sliders, and the list goes on.
But I wanted to focus on testing these basic Story types:
- Photos
- Graphics
- Videos
- Text Only
- Spotify
These content types are the most basic and pretty much all accounts have the ability to post them.
Accounts Used
For this test I used the @Agorapulse and @ScottAyres Instagram accounts.

I didn’t post at any particular set time or day. It was entirely at random.
This helps to remove any anomalies on the accounts based on time of day.
Below are screenshots of some of the Stories:

Data from Instagram Stories
Instagram offers decent insights on Instagram Stories. Evaluating their effectiveness is a struggle however.
Here’s what you see:
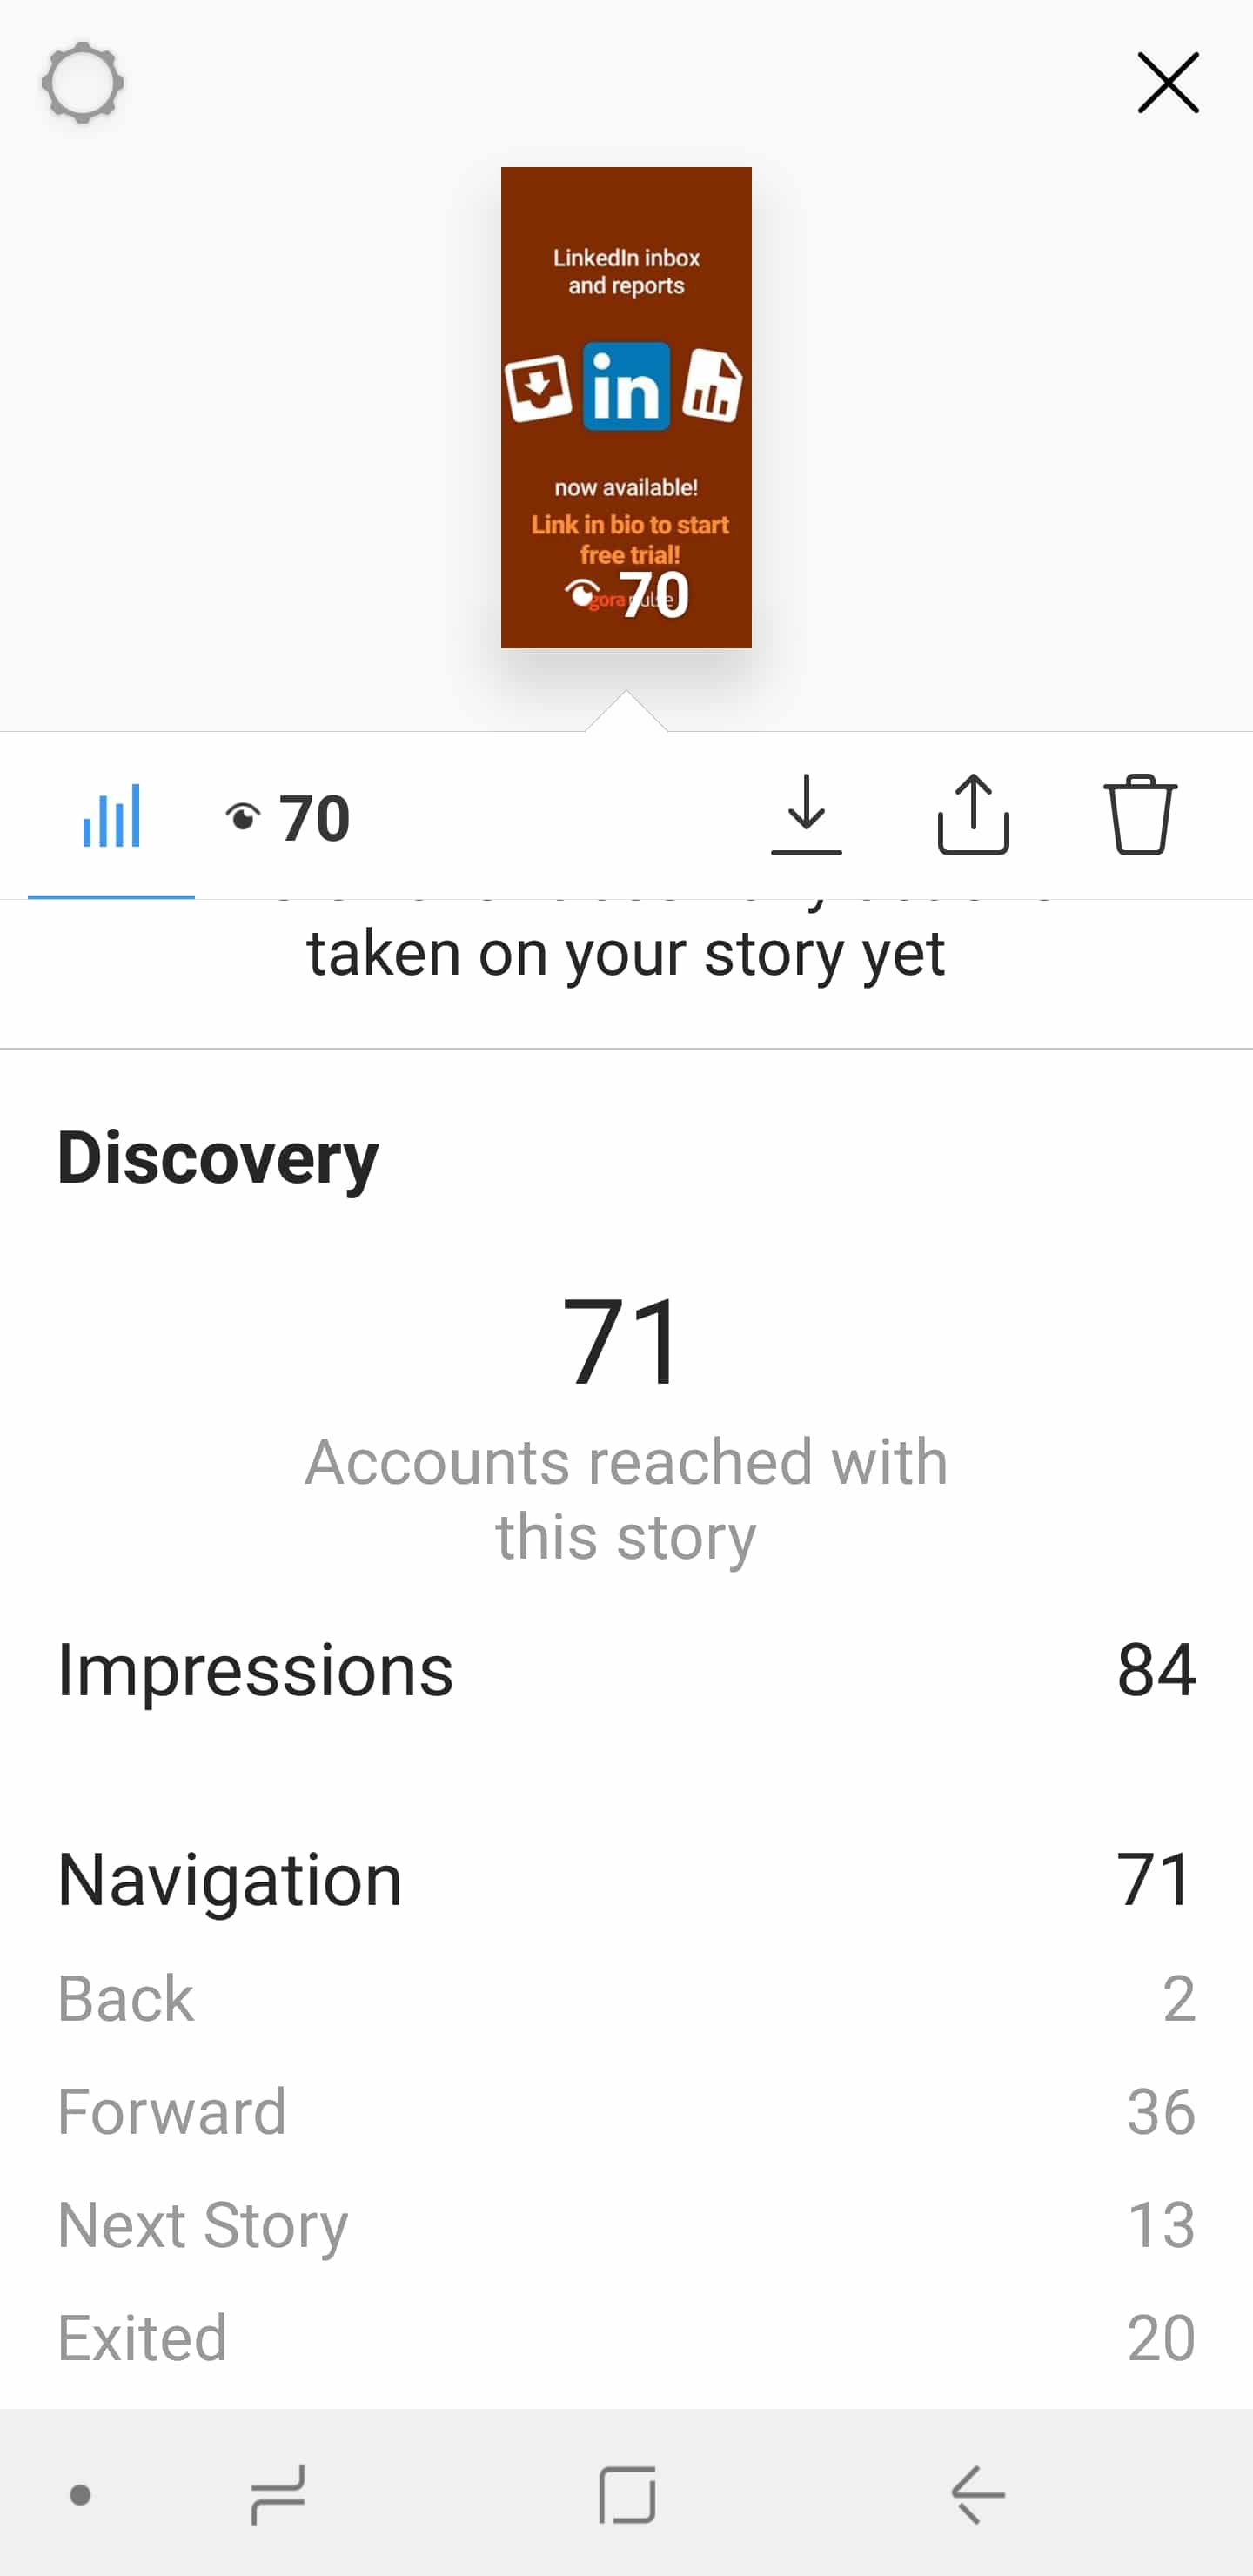
While “Accounts reached” and “Impressions” stats are important to measure in order to gauge if your followers are interested in your stories, it’s not the data set we will be focusing on. Because the user doesn’t know the type of content until they see your story, they just see your avatar at the top of their Instagram app letting them know you have a new story. Until they tap on it the content is a mystery.
I’ll show you data for Back, Forward, Next Story and Exited for each content type. Then see if we can draw any sort of conclusions.
The data below are the averages of all stories within each content type.
Photos:
- Back: 1.27
- Forward: 40.27
- Next Story: 11.47
- Exited: 14.00
Graphics:
- Back: 2.45
- Forward: 33.45
- Next Story: 11.82
- Exited: 11.00
Videos:
- Back: 2.00
- Forward: 39.38
- Next Story: 12.25
- Exited: 10.75
Text Only:
- Back: 0.75
- Forward: 43.25
- Next Story: 15.25
- Exited: 10
Spotify:
- Back: 0.5
- Forward: 29.50
- Next Story: 15.33
- Exited: 9.33
Ok.. So how the heck do we evaluate that data???
Going back to the article by Quintly on Instagram Stories we find out a few things:
- Back: A high number here can mean users liked the Story you had previously posted and wanted to see again. But also requires you having a Story within the 24 hour window to even get data
- Forward: A low number here is better, but also because Instagram users tend to have their thumb ready to tap on the right of your Story this number can get skewed by accidental taps (which could then lead to higher Back count)
- Next Story: A high number here is very bad. This requires users to swipe your Story away. Which means they were bored with you and wanted to move onto another user. They may not even view the rest of your Stories if this is the first Story they swipe on.
- Exited: This number doesn’t really matter a ton. The user may have just been done looking at Stories for that moment. Their boss walked in, their Uber showed up, or they needed to leave the bathroom!
For the purpose of this experiment we’ll use Next Story to draw a conclusion. Here’s how it breaks down per content type:
- Photos: 11.47
- Graphics: 11.82
- Videos: 12.25
- Text Only: 15.25
- Spotify: 15.33
Drawing a Conclusion Based on Data
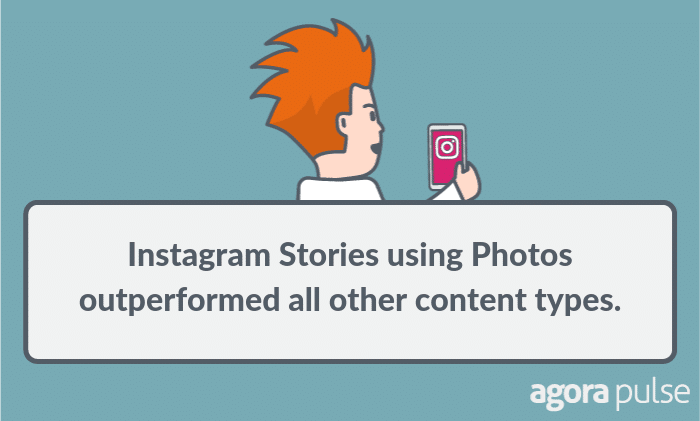
Based on this data Photos performed best and Spotify performed the worst. With Spotify having 33.65% higher swipes to Next Story comparatively.
SHARE WITH YOUR FOLLOWERS NOW!Click To TweetThat’s a significant difference.
Based on this data my hypothesis was wrong, video did not grab the most attention of users (or at least didn’t hold it as long).
But we really shouldn’t be shocked by this.
The Spotify Stories, as well as Text Only Stories, are the least personal and brand specific. Text Only tends to be generic in nature (even if you throw some stickers on it). And Spotify Stories have the worst backgrounds IMHO — but the stickers are fun and you get a free way to drive traffic to your Spotify podcast. Unfortunately, there is no way to track those clicks.
The nature of Stories is personal though and the performance of Photos helps demonstrate that.
Importantly, the Graphics and Video categories performed almost as well as Photos.
People want to see you, your brand, your product, your family, etc in Stories. Not necessarily be marketed to or bored to tears.
My advice is to mix in Photos, Videos and Graphics in your Stories, while avoiding Text Only as much as you can. And if your podcast is on Spotify you might put it in a Story, but don’t expect a ton of clicks…
**Catch the replay of the Social Media Lab LIVE show on this experiment:


