")

Subscribe to the Social Media Lab Podcast via iTunes | Stitcher | Spotify
Should Your Image Ads on Twitter Be Wide or Square?
Can the aspect ratio of a Twitter image ad impact the cost of advertising on Twitter?
That’s what we will find out in today’s Social Media Lab experiment.
Should Twitter even be considered as an advertising platform worth your time?
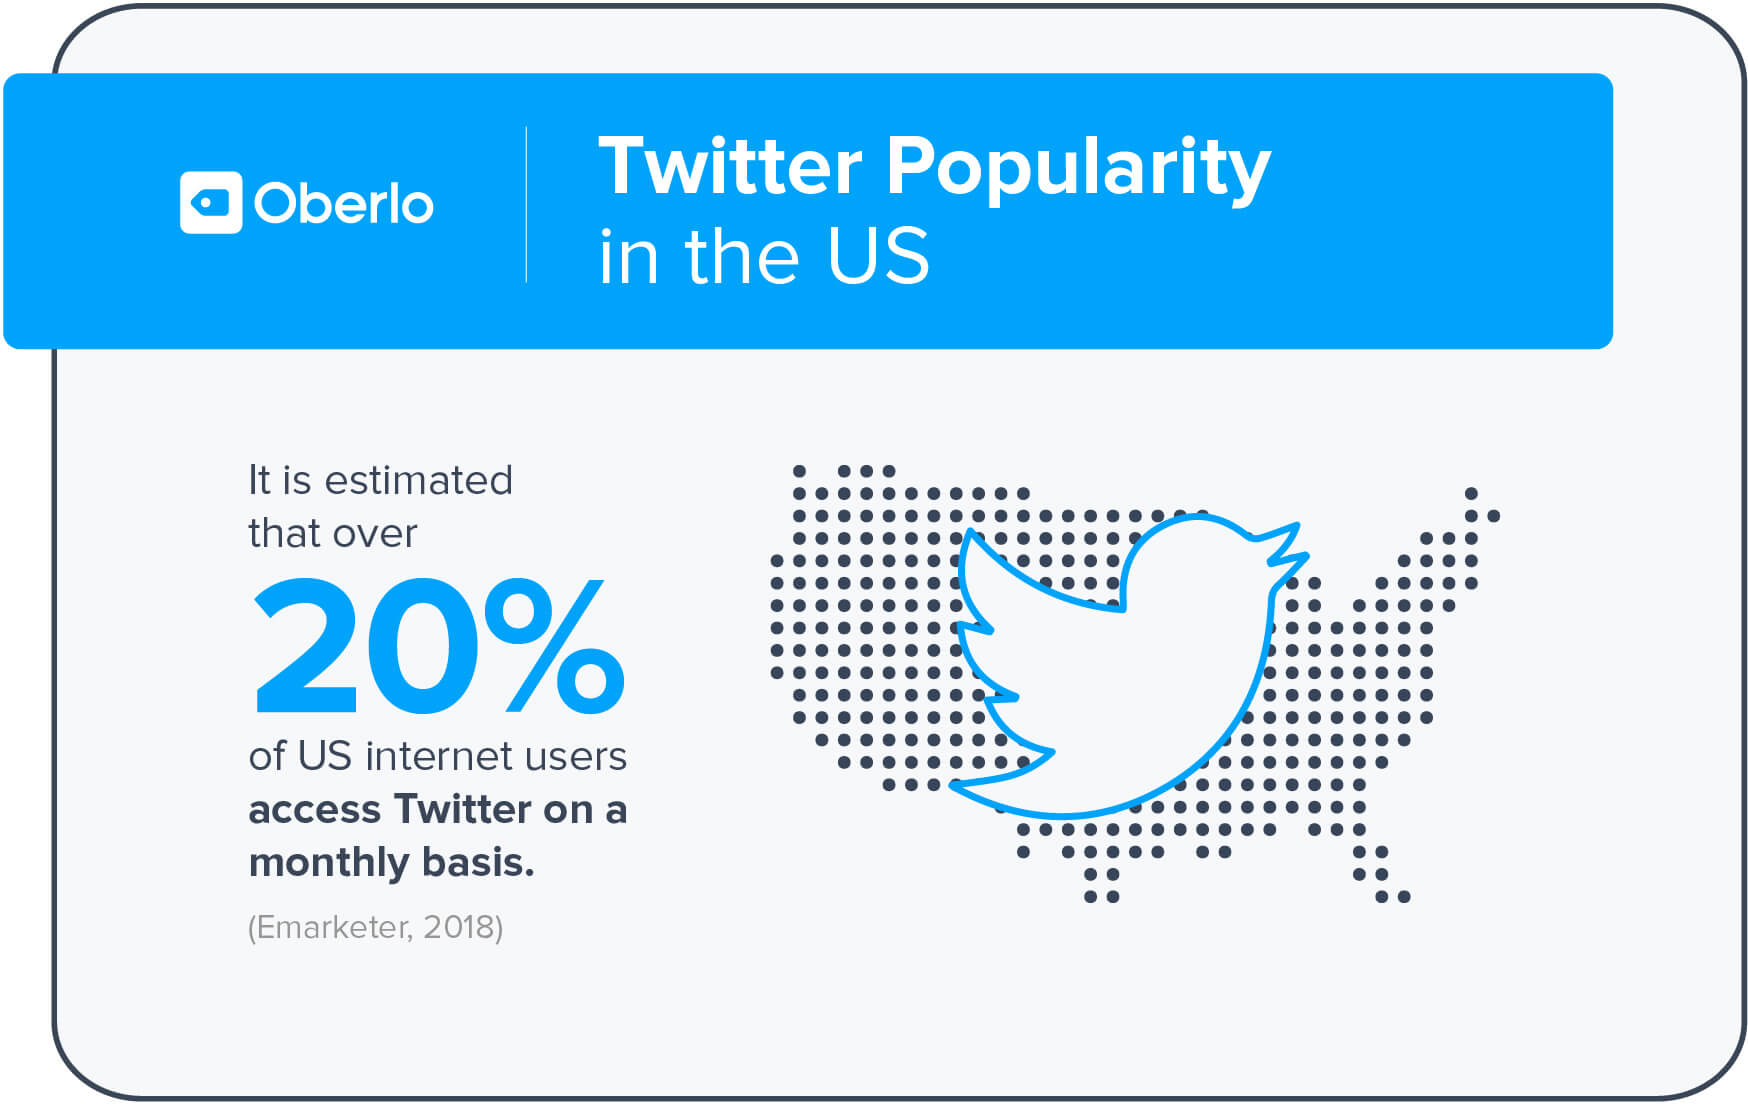
Twitter touts having 126 million daily active users as of February 2019. That gives businesses like you a large pool of users to advertise towards.
Oberlo also reports that 20% of US Twitter users access Twitter monthly.
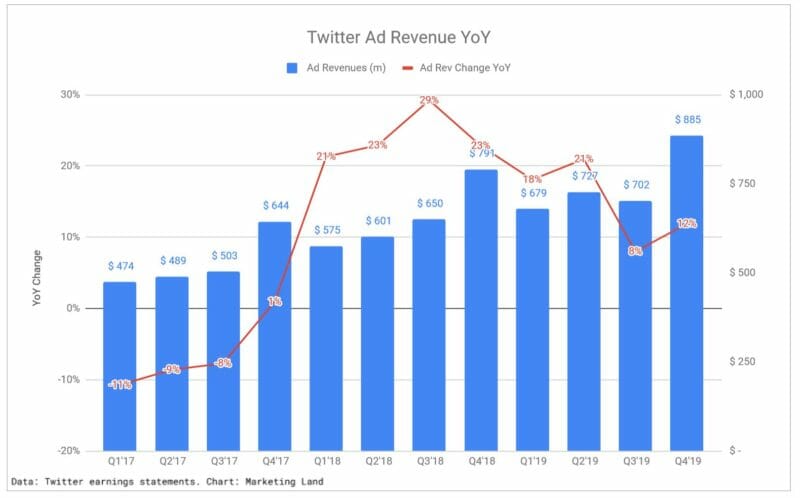
Twitter reported $885 million in ad revenue in Q4 2019:
All of this information equals lots of reasons and opportunities to advertise on Twitter.
Twitter allows many different ways to advertise on its platform. We’ll be testing images for this experiment.
Any aspect between 2:1 and 1:1 is acceptable. For example, 1200×600 (2:1), 1200×800 (3:2), or 1200×1200 (1:1). After 16:9 aspect ratio (for example, 1200×1400) it will crop to a 16:9 aspect ratio.
In this Social Media Lab test, we will compare a wide image versus a square image as our ad deliverable.
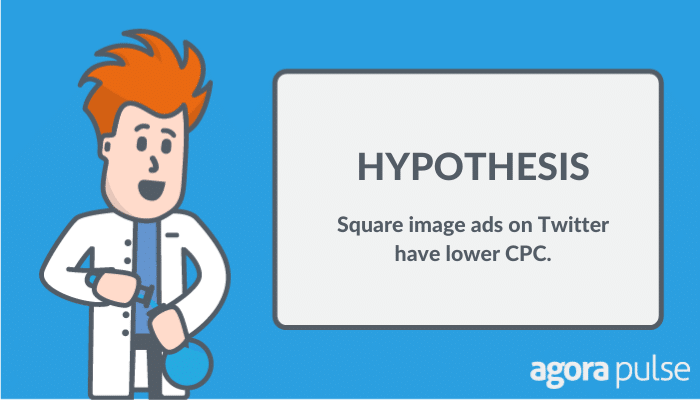
After much searching, I couldn’t find any studies comparing image ad size on Twitter. My hypothesis will be based on how ads appear on mobile devices since that is where most people use Twitter.
Hypothesis: Square image ads on Twitter have lower CPC.
Testing Wide vs Square Image Ads on Twitter
Using the Agorapulse Twitter account, we ran four different ads for this experiment:
- 2 ads with a wide image (directing traffic to different links)
- 2 ads with a square image (directing traffic to different links, but the same as the wide ads)
The ads were each run for two weeks. The first set was run in December and the second set in January.
Wide Image Ads:
Square Image Ads:
You’ll notice the ad copy for the coinciding square/wide image ad was identical. This is crucial to ensure our call to action didn’t impact the ad.
Ad Target
Followers of the Agorapulse Twitter account were the primary target, along with what Twitter would consider a “look-alike” audience.
Targeting look-alike audiences allows you to expand your ad to those Twitter users that might be more interested in your ad.
According to Twitter: “We determine users similar to those who follow accounts based on a variety of signals, including what they Retweet, click on, Tweet, and more.”
I selected English-speaking users as the main target (although I noticed after the test that all of the ads showed to a small number of users who didn’t speak English. )
In addition, the primary target was those in the United States, but as with the language target, those outside the US were served the ad. Perhaps this is part of the look-alike audience or from targeting the Agorapulse followers, which are global. The good news for our test is those outside the US and non-English speaking had 0 clicks, thus we weren’t charged for anything.
Twitter Ad Budget
Each ad a budget of €250 (euros). Euros is the default on the Agorapulse Twitter account because it was originally set up by a team member in the Paris, France office, where our company is based.
Depending on the current conversion rate, this roughly equals $270 USD per ad.
So, that’s four ads at $270 each, giving us a total ad spend of $1080 for this Social Media Lab experiment.
Data Points to Evaluate Twitter Ads
We’ll collect the following data for each ad:
- Clicks
- Impressions
- CPC
CPC will be the most important data to draw a comparison, but the other data points will help us see the full picture and gauge whether the results are statistically significant.
Coming to a statistically significant conclusion is important when testing as it lets you know if the results were just a fluke or something you and others should expect every time you test. The formula is long and complicated, but basically, we input the numbers of Impressions and clicks into an a/b split testing calculator and if we achieve over 90% certainty the study is statistically significant.
So, what did we find in this Twitter ad test?

Square Image Ads on Twitter Outperformed Wide Image Ads
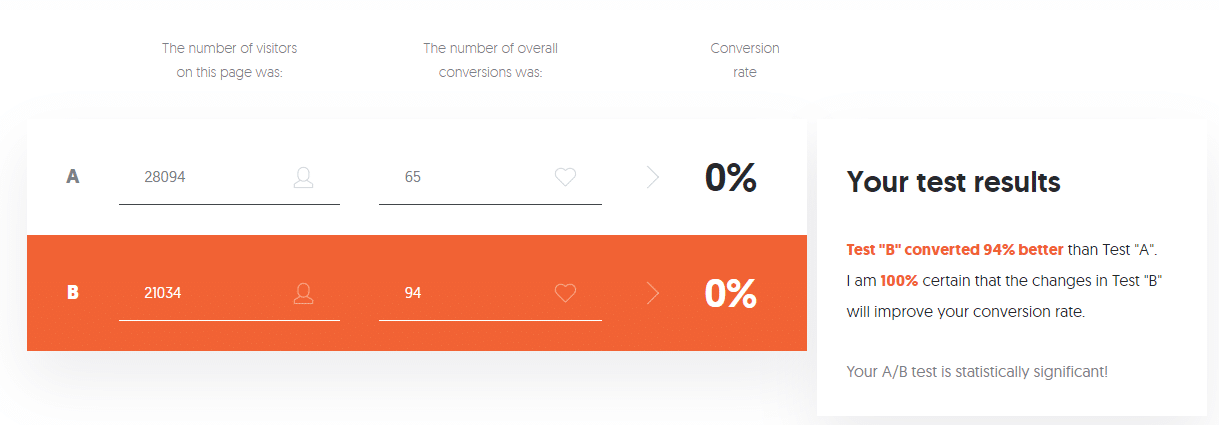
Here’s the data from each ad category we tested:
- Wide Image Ads Averages:
- Clicks: 65
- Impressions: 28,094
- CPC: $4.62
- Square Image Ads Averages:
- Clicks: 94
- Impressions: 21,034
- CPC: $2.97
The square image ads resulted in more clicks and a lower CPC (even with fewer Impressions).
Raw numbers don’t always convey the results well, because every ad, industry, and account will be different. The percentage differences though is quite revealing between these two ads.
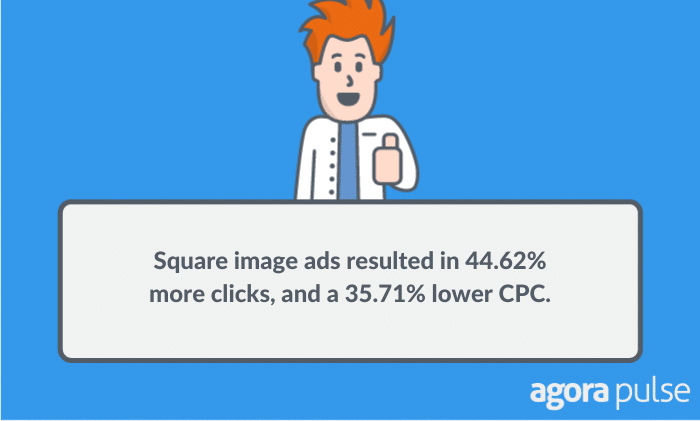
SHARE THE DATA WITH YOUR FOLLOWERS!Click To TweetSquare image ads resulted in 44.62% more clicks, and a 35.71% lower CPC. While doing so with 25.13% fewer Impressions.
*It should be noted that I was disappointed in the number of clicks and the higher CPC on these ads, especially compared to previous tests we’ve run on Twitter. Perhaps this was due to the narrow audience we targeted. Which could mean it was a better audience more interested in our content, thus costing us more. Nevertheless, both ad sets saw similar numbers so the percentage comparisons are valid for our study here.
A 35.71% lower CPC is enough to make me lean towards square images ads on Twitter moving forward, but is this statistically significant?
According to the A/B split testing calculator from Neil Patel, these results are statistically significant:
This is great news and leads the Social Media Lab to conclude that square image ads on Twitter win this experiment and are to be used more often when running Twitter ads.
My suggestion is to test square images on your Twitter ads the next time you run ads and compare to wide image ads to see whether your results are similar.
Remember to always tests across at least two ads in each category to ensure you didn’t have a fluke incident occur. Also, be sure to target the exact same audience with each test so your data is not skewed.
Got an idea for a test for the Social Media Lab? Join our private Facebook group ASAP and share your idea with us.