


Subscribe to the Social Media Lab Podcast via iTunes | Stitcher | Spotify | Google Play | RSS
Does Targeting the Top 25% of Website Visitors by Time Spent on Site Yield Lower Cost Per Free Trials and Subscriptions?
We’ve all heard the saying: Always pick the low hanging fruit first, right?
While this might seem like an obvious choice for targeting in your Facebook Ads, it’s surprising at how many people either do not know how to do this, or they just simply don’t do this in their marketing campaigns.
There are so many ways to accomplish this now with Facebook’s Custom Audiences that it almost seems irresponsible, and even downright negligent for a business owner not to try to tap into these audiences.
Since about 2016 Facebook has given us the ability to segment our website visitors into audiences such as; Top 25%, 10%, & 5% of individuals who have spent the most time on our websites.
Pretty amazing, right? Well, we’ve heard time and time again, on forums, blogs, and even Facebook has said that these audiences are some of your most loyal fans and that creating audiences with these parameters is a must.
Well, not so fast. It’s one thing for us to sit here and tell you how amazing it can be, that it’s working for others, and everyone is doing it.
But, we all know what you’re thinking.
Where’s the hard data to back these claims?
And, with that, another Agorapulse experiment was born.
Why We Conducted the Experiment about Ad Traffic
After observing several different sources talking about how targeting people by time visited on your website was very effective. We decided to dig a little deeper, and actually throw thousands of dollars behind an experiment to test the claims.
So, some of the questions that came to mind when hearing these claims were:
- Are people who spend more time on your website really more engaged, and more interested in your product/service?
- Will people who spend more time on your website more likely to convert?
- Is there any significant differences in the campaign performance (cost, reach, relevancy) when targeting these audiences.
Since there are so many variables from business to business, we ran a quick “pre-test” to determine if the results warranted a larger investment to further test our hypothesis.
We want to find out if people who spend more time on our site are more likely to become free trial users than people who spend less time on our site.
Hypothesis:
Time spent on a website will not impact conversions to a free trial user or paying customer.

Experiment Setup
We set up the experiment to target the top 25% of people based on time spent with one campaign (Audience “A”). A second campaign would target the bottom 75% of our website traffic (Audience “B”).
The idea here was to segment the two audiences so we could run the same copy and creative to both audiences giving us at least some control over the variables in the experiment.
Campaign Details
When creating the campaigns it was relatively easy to set this up. We had one campaign that included the Audience A, and one that only included Audience B. (see below)
- 2 Campaigns
- Audience A
- Audience B

Ad Set Details
Within each campaign, we set up 3 different Ad Sets. Each Ad Set had a single ad running.
In other words, each Campaign included the following:
- 3 Ad Sets per audience
- 1 ad in each ad set

The naming conventions here were all jumbled up as we had used a 3rd party tool to set up the campaign.
Ad Set #1 / Audience A
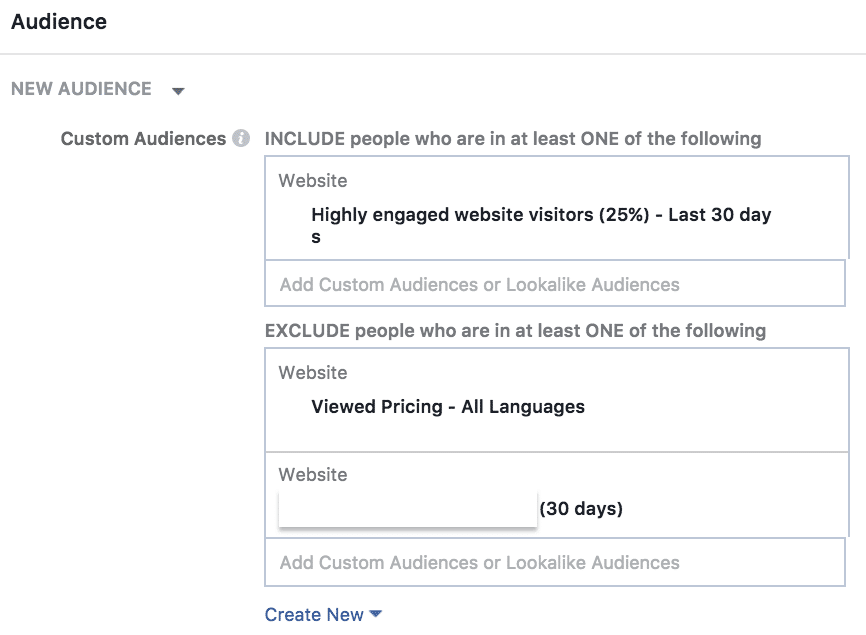
All website visitors in last 30 days including:
- The top 25% by time spent on website in last 30 days.
- People who visited the pricing page in last 30 days.
- All affiliate traffic.
- All free trial users and subscribers.
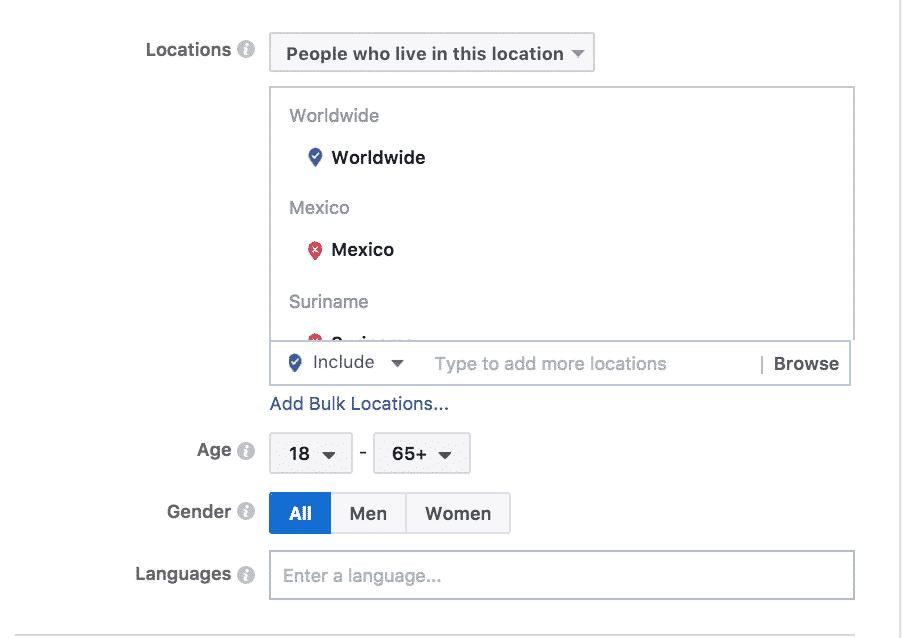
- Worldwide, excluding Spanish, Portuguese, and French speaking markets as we have websites in these languages serving these markets.
Placement
We only used the Desktop News Feed because other placements don’t give us the ability to properly track conversions. (This is due to our mobile limitations.)

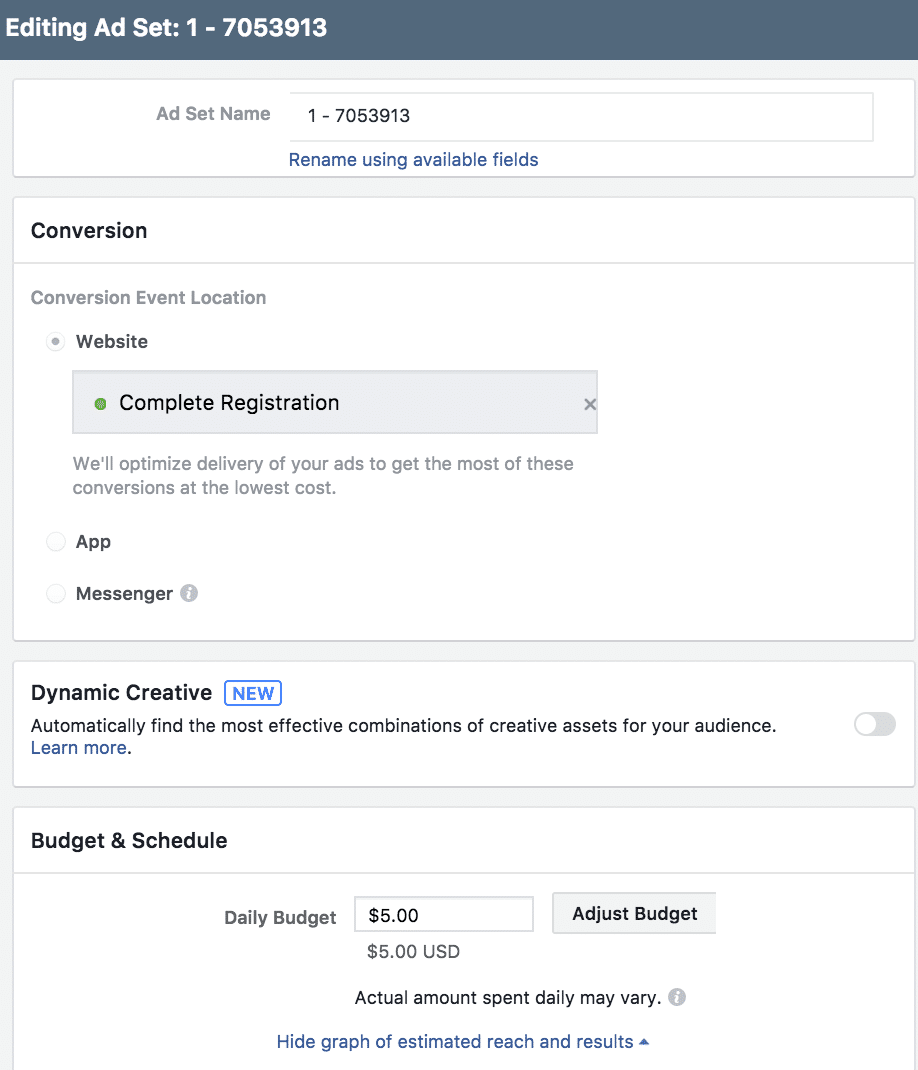
For the conversion window, we chose a 7-day click and left the bid at automatic.

Ad Set #2 / Audience B
The controls, placement, conversion window, and bid were all set up nearly the same as Ad Set #1 / Audience A. The only exception was the audience. For this Advertisement we excluded the top 25%.

Ad Creative & Copy:
As mentioned earlier, we had 3 ad sets in each campaign, each with one ad. This means we had 3 different ads running for each campaign.
The ad creative we tested for all three ads in both campaigns were fairly similar. The copy was kept identical across the three different advertisements.
There were just some slight variations in the color palette and verbiage.


Experiment Results
It’s time to reveal the results!
For this experiment we spent just over $1042 and split the budget evenly between the two audiences ($521.05 on Audience A and $521.78 on Audience B).
The even split of budget gives us a fair comparison of both campaigns. If we noticed a difference, it would unlikely be due to the higher spend in one campaign over the other.


In the screenshots above, you can see that we had a number of conversions recorded:
- 9 website leads.
- 25 website registrations.
- 1 website purchase.
Website leads refer to people who either signed up for our regular newsletter or opted in to use one of our free tools.
Website registrations refer to people who signed up for a free trial of Agorapulse within 28 days of clicking on one of our ads. On the other hand, website purchase refers to the people who became a paid subscriber within 28 days of clicking on one of our ads.
Considering that our hypothesis was about free trials, we disregarded website leads because it is not a key metric for disproving our hypothesis.
Next, we used an A/B test calculator developed by our in-house data scientist to verify if the difference we saw in both campaigns was statistically significant, so that we could tell if the difference would repeat itself if we were to run the campaigns again.
Here’s what the calculator tells us about our reach and link click data:
(for these images Audience A is the top 25% of visitors and Audience B is the remaining 75% )
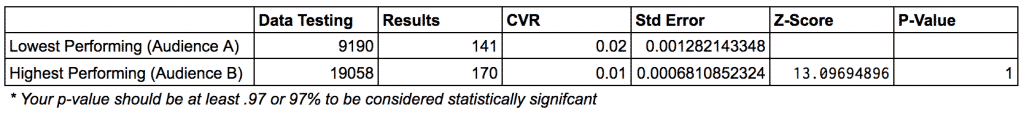
It shows, with 100% certainty, that Audience A is more likely to click on our ad than Audience B.
And here’s what the calculator tells us about our traffic and free trial conversion data:
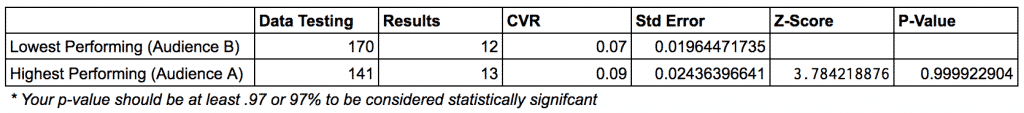
Note that Audience A is now the 2nd row in this screenshot, as the calculator requires the data with lower results to be on the first row.
Like the earlier screenshot, this shows that Audience A (second row) is more likely to sign up for a free trial.
In other words, someone from Audience A is both more likely to click on our ad and sign up for a free trial.
What about paid subscribers?
In Audience A, we had 13 free trials and none of them became a subscriber in the 28 day window that we mentioned earlier.
On the other hand, one of the 12 free trials from Audience B signed up for our $99/month plan and became a paid subscriber.
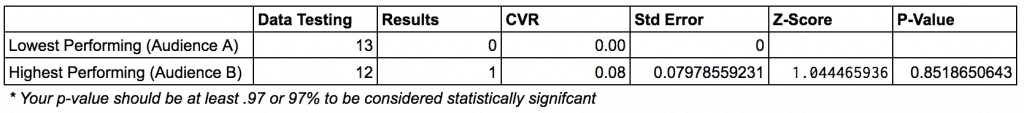
However, the calculator tells us that the difference between both Audiences A and B in their likelihood to become a paying subscriber is statistically insignificant. The difference is too small to disprove the hypothesis that there is a meaningful difference in both campaigns’ likelihood to drive paid subscriptions.
Insights
1. Conflicting Results
In theory, Audience A should have outperformed Audience B by a large margin.
After all, Audience A comprises people who spent the most amount of time on our website, and if they spent this much time on our website, they must be the best kind of prospects, right?
While Audience A had a higher tendency to click on our ad and convert into a free trial, they weren’t necessarily more likely to convert into subscriptions.
This suggests that perhaps the sales process is more important in determining if a someone who signs up for a free trial eventually turns into a paying subscriber.
Another reason might also explain the reason why Audience A is more likely to sign up for a free trial.
Despite spending similarly on both ad sets, Audience A reached 10,000 fewer people than B. This was because Audience A was a smaller size compared to B.

But as you can see, by spending the same amount of money on a smaller group of people, frequency was higher for Audience A than B.
This means that the average person in Audience A had seen our ads more often than B – therefore more chances to take notice of our ad – and this could have explained the reason why more of them converted into free trials!
2. Don’t Let “Expensive” Free Trials Fool You!
When we looked into the ad sets, we realized one thing that we saw happen during past experiments.
That is: Even ad sets which cost higher per free trial than our desired benchmark can be profitable!
In this case, you can see that our sole $99/month subscription from the month-long experiment came from one of the ad sets which scored the fewest free trials.
The lesson? Give your ad sets a chance to “prove” themselves – try not to judge too quickly based on cost per leads, installs, downloads, etc. Look at downstream conversions.
Do they tend to buy more?
If they do, then the campaigns with the highest costs may just be your most profitable campaigns.

3. More Optimization is Needed
When we first started this experiment, we wanted to see if the initial results would encourage us to create an evergreen campaign to continuously target the people who spend the most amount of time on our site.
By the end of the experiment before the “cooling off period”, we waited for 2 weeks to see if there were any free trials who signed up later. At that time, we had 13 free trials from Audience A and 12 free trials from Audience B, but none of the 2 ad sets turned in a single subscription.
After the “cooling off period”, one subscription appeared on one of the campaigns!
Based on the historical customer lifetime value of our customers, this experiment instantly turned potentially profitable.
When we looked back at the campaign, we realized that we had overpaid for each click. Because of a relatively low link click CTR, we forked out $3 per click!
Applying our hindsight “bias”, we would have done the following:
- Optimize ads until we achieved clicks costing less than $1. The lower the cost of each click, the more data we can gather. This would increase the efficiency of our budget. If each click had cost $1 instead of $3, we would have 3 times the amount of data in this experiment!
- Spend more over a longer period, which would give us greater visibility over the success of each ad set. Imagine if we ran the campaign for 2 months instead of 1 – that would give Facebook even more time to gather data and reach a wider spread of people, thus increasing the probability of getting more conversions and data.
Conclusion:
Although the results from our experiment were statistically significant, they did leave us a bit perplexed and without a solid conclusion.
However, it gave us enough information to know that it is definitely worth testing more.

And while further tests will be cooked up in Social Media Lab, we’ve learned that the claims of targeting the top 25% of your website traffic might not be as lucrative as some claim.
But, with that said, we’re definitely going to give this one a try again in the near future, and like we explained in the insights, we’ll make some necessary adjustments that should help give more credibility to this theory.


