

Subscribe to the Social Media Lab Podcast via iTunes | Stitcher | Spotify
Is There a Penalty for using Twitter Scheduling apps?
A previous Social Media Lab study found that Facebook doesn’t penalize the reach of posts by third-party scheduling apps.
But I started to hear rumors and questions from thought leaders that Twitter might be penalizing posts made with apps on its platform.
Buffer ran a small test of its own to see how apps performed on Twitter and found these results:

This idea came to the forefront of my thoughts after Ian Anderson Gray and Julia Bramble discussed it in their “Free Range Social” on Facebook Live.

In the broadcast, Ian said:
“Are you getting lower engagement on Twitter when posting with a scheduling tool as opposed to on Twitter?”
He added:
“We believe (posting with scheduling tools) gets lower engagement.”
Ian also challenged us to test this in the live broadcast.
Challenge accepted.
How We Tested Third-Party Scheduling Tools on Twitter
Impressions will be the best data point to gather in order to draw a conclusion on this matter. (Not engagement data points.) This gives us a good data point that should be universal to all accounts, regardless of engagement numbers.
We will gather Link Clicks, Likes, and Retweets solely for comparison purposes and perhaps further blog posts.
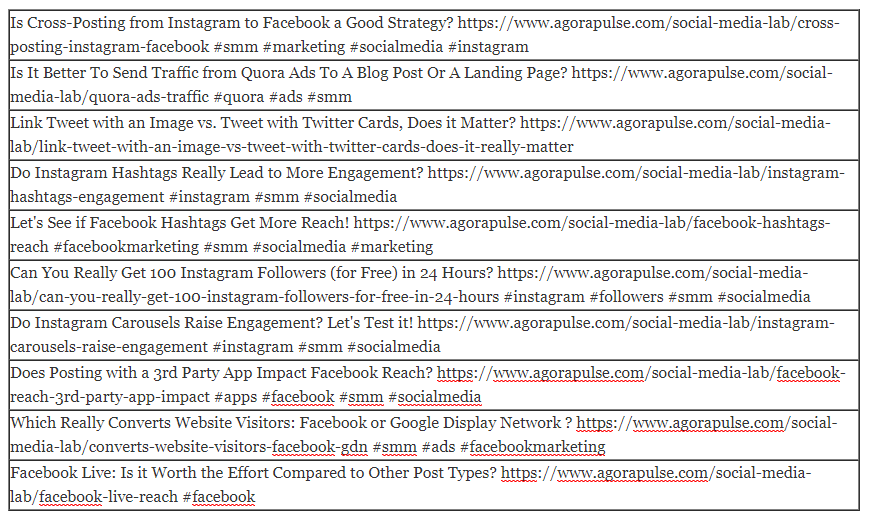
For this Social Media Lab experiment, we’ll use the same 10 links (with the same text and link) to make scheduling simpler.
Here are the tweets:
Twitter Accounts to Test Third-Party Scheduling Apps
To properly test something, we need to post using multiple Twitter accounts and using multiple tools.
For this study, I will post to my following accounts:
- @scottayres | 11,280 followers when testing started; 12,613 when testing ended (11.82% increase)
- @thesmbuzz | 6,145 followers when testing started; 7,498 when testing ended (22% increase)
- @fbanswerman | 8,230 followers when testing started; 8,343 when testing ended (1.37% increase)
The follower count and increases will be important in our conclusion.
I’ve had these three accounts for years and predominately only post links to social media related accounts. For most of 2017, I’ve only posted links to Agorapulse or Social Media Lab blog posts.
Apps Used for Testing:
- Agorapulse
- Buffer
- Post Planner
- Hootsuite
I chose th0se four third-party scheduling apps due to their popularity in the social media space and their use by a wide array of businesses.
Amount and Frequency of Posts
We will need to get average Impressions over at least a week of manual tweeting per account to set a baseline.
The pain point here: Keeping up with posting manually and getting enough data to test.
For the apps, I’ll schedule 100 tweets per account, with 14 tweets going out per day for 7 days. I’ll tweet links only to Social Media Lab blog posts.
If these numbers hold steady and everything posts as planned, that will give us about 1,500 tweets to pull data from.
During the testing, I’ll still retweet and engage with people as usual, but will only pull data from tweets using these links.
Schedule
Our Social Media Lab experiment will take a minimum of five weeks to post, then gather data at least two weeks after the last post is made. This is done to give each tweet as many Impressions as possible.
Here is the planned schedule for the test:
- Manually tweet starting Sept. 27, stop on Oct. 8 (The data from this was scrapped. I’ll explain later)
- Post Planner started Monday, Oct. 9; 10 links, 14 posts per day for 1 week. Each post was set to “Re-Cycle” in their app.
- Agorapulse started Monday Oct. 16; 10 links, 14 posts per day for 1 week. I set the posts to “Re-Queue” in the app.
- Buffer started Monday Oct. 23; 10 links, 14 posts per day for 1 week. Had to add in the 100 tweets and add to their “Queue.”
- Hootsuite started Monday Oct. 30. Only 10 posts per day were allowed. I had to keep adding them every day to keep it full.
Just to clarify “Re-Cycle” from Post Planner and “Re-Queue” from Agorapulse basically work the same.
What this does is keeps the content on a repeating schedule. So once the tweet goes live it comes back into the schedule to the end of the schedule and is ready to go out again.
Buffer doesn’t offer this re-cycle/re-queue function, nor does Hootsuite.
Hypothesis: Posting with Third-Party Scheduling Apps to Twitter Will Not Have a Substantial Negative Impact on Impressions
Based on the conclusion in our third-party app test for Facebook, I’m going to make the following assumption:

The Engagement (link clicks, likes and retweets) will be 100% different for every person and is dependent on the account and post. Thus why I’m focusing on Impressions.
Resulting Data From Testing Third-Party Scheduling Apps on Twitter
First, let’s look the average Impressions per tweet for the apps:

As you can see, some apps had higher Impressions on one Twitter account but lower on another (which is what I expected as Impressions can be swayed depending on the Engagement rates).
If we take a look at the Likes per app, we can somewhat see a correlation—although it’s not exact as we’d also need to factor in Link Clicks, Retweets, Profile Clicks, Hashtag Clicks, etc.

I’m only showing you this info to show you that each app performed differently. I wouldn’t call anyone of them the “Winner” here.
But how does this compare to the Impressions from the manually posted tweets? That’s what really matters.

On the @scottayres account, Post Planner and Hootsuite had higher Impressions than manual tweets, but on Agorapulse and Buffer it was lower.
The @fbanswerman account (which has a pretty low Impression ratio) fared better on all four apps compared to manual, native tweets with a whopping average 86.52% higher!
Whereas the @thesmbuzz account was lower on all four apps, averaging 31.93% lower Impressions than manual tweets.
Overall, apps saw a 10.30% lower Impression average per tweet than manually posted tweets.
(If you want to see the rest of the Engagement data and per tweet data scroll down and click the image to grab it!)
If I’m being honest here, the @fbanswerman and @thesmbuzz accounts were somewhat neglected for a while and I rarely interacted on them until recently. I had started both for podcasts I started years ago, then they went dormant. I started tweeting with them again earlier this year and only recently have I started to reply to mentions using our Agorapulse app.
To say they are “side accounts” is an understatement.
The account that I’ve always been active on and use daily is my @scottayres account.
If I were to compare my account to another influencer with a similar following, such as Jenn Herman, and the Agorapulse account you’ll see I’m not faring too badly:
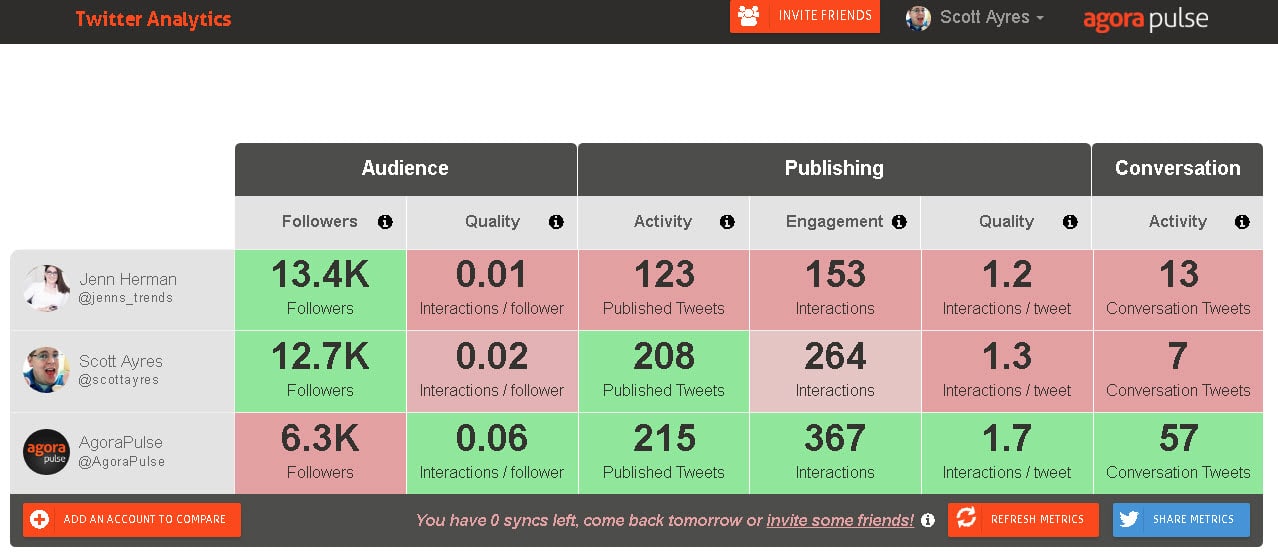
Jenn and I have very similar stats across the board, with my account having more Interactions.
The Agorapulse account wins this battle however due to our team using our tool to engage and listen to Twitter so much better than I do!
I only show you this to say I hold more value in the data from the @scottayres account than I do the others.
If we were to remove the other two accounts and only focus on my @scottayres account, the decrease in Impressions for apps versus manual tweets would be 7.37% as mentioned earlier.
For me that’s a number small enough to me as someone who is tweeting 10-15 times per day using an app doesn’t sway me one way or the other.
Conclusion About Third-Party Scheduling Apps on Twitter
My original hypothesis was: Posting with 3rd Party Scheduling Apps to Twitter will not have a substantial negative impact on Impressions (I predict a +/-10% difference).
Based on this, I’m calling this a draw. There is no real winner or loser here regarding Impressions.
If the overall number, or my individual number, had been 20% or more, I would say posting manually to Twitter wins by a landslide.
But being down 10.30% and 7.37% respectively doesn’t sway me to stop using apps to post to Twitter.
Why not?
Remember the increase in followers I mentioned earlier?
The @scottayres account saw an 11.82% increase in followers by the last day of testing. The testing for the native Twitter posts was done on the final week of testing. It’s very easy IMHO to correlate that increase of 7.37% Impressions for native posts along with this increase in followers.
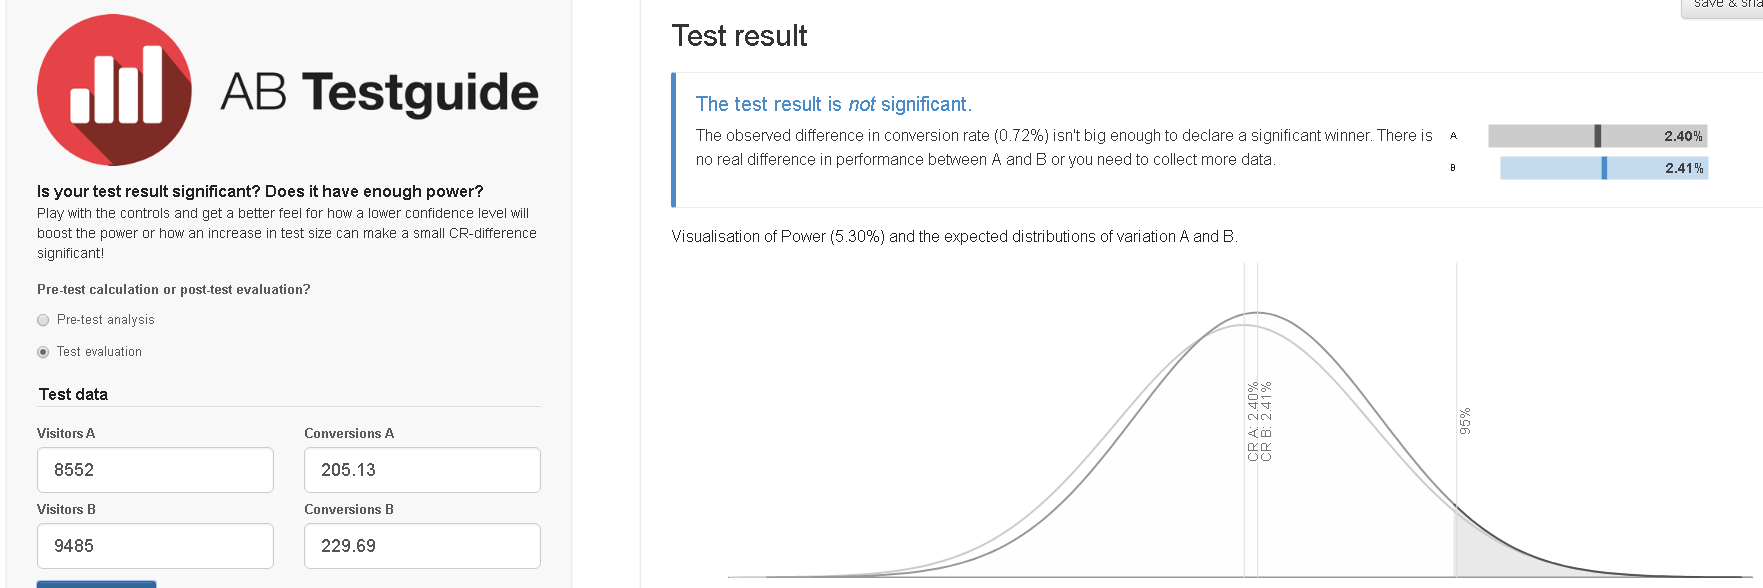
When we apply statistical analysis taking into consideration the follower count when started, compared to the follower count when we ended. And input the average Impressions of all apps and the native tweets we find the data is not significant. In other words: There is no real difference due to the growth in followers.
In the graph below “A” is when the test started with Impressions of apps, “B” is when the test ended and Impressions of Twitter native posts.

Even when I changed out the numbers to match the following scenarios for the @scottayres account, the results were not significant:
- Compared beginning follower count during app testing compared to beginning follower count for native Twitter posts
- Compared ending follower count during app testing compared to ending follower count for native Twitter posts
I went even further to make sure this conclusion was solid by averaging the follower count of the 3 accounts at the beginning of the test and the end of the test and compared the app average Impressions with the native Twitter Impressions and it was still not significant.
- Average following at start during app testing 8552 with an average Impression of 205.13
- Average following at the end of the test and during native tweets 9485 with an average Impression of 229.69
I’m convinced beyond a shadow of doubt: There is no penalty being put on tweets schedule with third party scheduling apps.

I’m going to continue using apps to post my link posts due to this.
Especially when I take into consideration how hard it was to remember to tweet manually throughout the day! I’d miss days, or go 8 hours without tweeting. Lose track of which tweet was next and had to constantly log in and out of each account. It wasn’t ideal.
You should continue to be “social” on Twitter and get into conversations, reply to @mentions and retweets, etc. But scheduling your posts is not a bad thing, and you should have confidence now to proceed with doing it!
Challenges Faced During Testing
Problems with Manually Tweeting
Manually attempting to post 100 tweets per account in a week or so was brutal. (This is when scheduling and using automated tweets would have been nice!)
Originally my plan was to start Sept 27th and end a week later, but I wasn’t near the number I wanted, so I continued to Oct 8th.
But when I started pulling the data in late October I noticed something troubling.
My Impressions seemed to be plummeting from about August to October, and finally leveling back out to a consistent number each week mid-October.
The original numbers I had gathered for the manual tweets was very high compared to the numbers for the apps.
I went and looked at analytics for 2 other accounts not in this test and noticed the same trend.
So either I was being punished for posting the same links so much, or more likely a change in Twitter’s algorithm had occurred giving me lower Impressions.
Twitter had just rolled out their “Twitter Promote” option at about this time, and with their focus on this and other ad options it’s safe to assume some drop in organic Impressions would happen. Same can be said for Facebook and LinkedIn.
So on November 27 I began manually tweeting the same links again, and ended up with about 30 tweets per account over a 10 day time period. The Impressions from these tweets was similar to what I was seeing from the apps (but not exact, as you saw earlier).
I scrapped the original data for the manual tweets in lieu of these later published tweets for my analysis.
Scheduling App Problems
Scheduling this many tweets can be daunting on each platform. Some are easy, some are not.
Some also had multiple failed tweets along the way, mainly Hootsuite.
I constantly had to reconnect two of the accounts to Twitter after realizing 10 or so tweets had failed.
Plus Hootsuite doesn’t have a Queue schedule like the other apps, or I couldn’t find it anyway. So I could only add in 10 tweets per day and it picked the times. Which I didn’t appreciate or like.
I ended up on the @scottayres and @fbanswerman accounts having 65 tweets sent via Hootsuite. Whereas on the other apps I had right at 100, if not more, during their week of testing.
I also had to be up around midnight every Sunday night to stop the tweets from 1 app and start the tweets from another. ZZZzzzzz…
Further Thoughts about This Test
I chose to use the same 10 tweets over and over to try and be as fair to each app and manually tweeting as I could.
Did this hurt me? Maybe.
Twitter may have seen me posting the same exact tweet every day for about 60 days and crushed my Impressions.
But I do feel this was the best way to get results that were fair and balanced.
I wouldn’t recommend this posting strategy on your own accounts though.
I’m all for recycling and re-queueing your tweets. But have at least 50 in your arsenal so that if you do tweet about 15 times per day, it’s a few days in between posts.
It would be even better if you had a few 100 tweets in your Queue so that they take even longer to cycle around.
Guys like Jeff Bullas have bout 550 tweets they recycle over and over, making the same tweet come around every 4-5 days. Enough gap that most that are on Twitter won’t notice you re-posting over and over and over!
I’m gonna keep posting to Twitter with scheduling apps — I’d recommend the same to you as well. But I’ll stick to just using one for now on!


