

Do you feel lost when looking at your Facebook statistics? Well, you’re not alone. The amount of metrics is overwhelming and most of Facebook insights terminology is still hazy for the rest of us. And even if the new Facebook page insights brought a lot of improvement, there is still room for improvement.
As a marketer, you know that what can be measured can be managed (and improved) so whatever the complexity, we need to measure our Facebook’s performance. And you’re right. But you also probably know that too much information equal no information and that we only need to measure what we can improve. And you’re right too.
To help you measure your Facebook page’s performance, I advise you to focus on post metrics only. This is because they are the only relevant indicators of the performance of your content. Fan growth can be tricked, daily or monthly reach too, and if your rely on Page metrics such as growth or daily reach, it’s not too complicated to turn a “bad” page into something that looks OK from a distance. but it’s very hard to trick individual post metrics.
In this article, I will:
-
- o
- Help you identify the 6 key metrics you need to follow to really understand how your Facebook page is doing,
o
-
- Show you where to find them,
o
- Explain what they mean for your Facebook performance and why you should care.
Facebook metric #1: Fan reach
What is it?
Fan reach simply corresponds to the number of fans of your page who have seen any given post. This reach is part of the “organic” reach family, which means that it only records the views that occurred directly, and not through an action of a friend (such as a like, share, or comment). The views that are a result of a friend’s actions are recorded in “viral” views.
Where to find it?
The Fan reach metric is now available in the Facebook statistics interface (it was only available in the Excel download in the old insights). See below:

The “Fans reached” metric is easy to spot in your Facebook insights. In the posts menu, click on the top left arrow and select “reach: Fans / Non-Fans”. Then, hover to each graph and you’ll see the number of fans reached for the concerned post.
Why it matters?
The Per-post-Fan-reach is probably the most important metric. Its importance is due to being a key indicator of the appeal of your content to your audience and the quality of the said audience.
An audience recruited from an eye-catching contest (or worse, bought by the thousand from sites with practices as questionable as their effectiveness) will quickly hide your posts from their newsfeed. If they don’t actively unsubscribe, their lack of interest, and therefore disengagement, will cause them to be effectively unsubscribed from your publications due to the relentless effect of Edgerank.
Fan reach is a key indicator of the health of your Facebook page. The higher the quality of your audience and the more interesting your content is, the greater the increase in percentage of fans reached will be — and vice versa.
Facebook metric #2: Organic reach
What is it?
Organic reach corresponds to the number of people, fans and non-fans, who have seen a given post. As with fan reach, organic reach only records views which are not the result of a friend’s action (that would be counted in the viral reach). The real difference between the fan reach (above) and organic reach is that the latter includes views of people that are not fans of the page but have directly accessed your page or seen its content in a widget (for example, a “like box” on your site or blog).
Where to find it?
The organic reach is easier to spot as it is located within the insight interface of your page. Just go to your insights, click on “posts”, scroll down a little and you’ll see the “reach” number for each post. hover your mouse on the bar chart for “organic” and you’ll see the right number. I agree, this is almost 3 clicks for each post, but at least you don’t have to download the excel version and get lost in the never ending list of tabs and columns.

Once on the insight interface, click on the number of people reached for the concerned post and hover your mouse over the “organic” bar chart, you’ll see the Organic reach number for that post.
So, for lack of being able to see fan reach in the Facebook interface, organic reach can serve as a substitute data point.
On the other hand, it won’t be exact and in some cases could even be quite different from the fan reach.
In the two examples below, we found differences between these two metrics that range from a few percent to more than 80%! So before deciding to rely on organic reach as your preferred metric, make sure it is not too far from your fan reach.

The difference between fan reach and Organic reach can vary significantly from one page to another. In the two examples above you can see that for two different pages, that difference can be 5% for one or 110% for the other! So before relying on Organic reach instead of fan reach, check if your page has a big difference between the two.
Why it matters?
It can replace fan reach in the metrics you want to follow, but only if the average difference between organic and fan reach is not too high in your case.
Otherwise, it can help you identify ways to improve your content organic visibility. For example, an organic reach that is very close to a fan reach usually means that people cannot be exposed to your content if they are not already a fan. This could be the consequence of a lack of proper communication about your fan page on your other marketing channels. If you have a website, a blog and a newsletter and no or very little difference between your organic and fan reach, it probably means that you are not attracting new “non fan” audience to your content.
If it is your case, try to better promote your page on these other channels and you should see your organic reach going up.
Facebook metric #3: Engagement
What is it?
As defined by Facebook for post level metrics, engagement is “the number of people who clicked anywhere in your post”. That means liking, commenting and sharing, but also people who’ve viewed your video, clicked on your links and photos, but also, clicked on a commenter’s name, liked a comment, clicked on your page name and even gave negative feedback by reporting your post.
Basically, it is the metric to follow right after the reach metric. Reach tells you how many people have potentially seen your content, engagement is the number of people who have acted on that content.
In a way, engagement is less “virtual” than reach. If 1,000 users have been reached but your content, you have no way to know how many of them have actually spent the time to read it. With engagement, if 1,000 persons have clicked on your content, 1,000 have clicked on your content. No guessing, that’s the number.
Where to find it?
To see the engagement metric for each post, go to your insights at the same place where you spotted the organic reach. The number of people who “engaged” with your content (means clicked on it, liked it, commented it or shared it) is in the “Engagement” column. To have the total engagement though, you’ll have to add the number of post clicks and the number of likes, comments and shares.

The “Engagement” metric is fairly easy to spot in your Facebook insights, right on the “Posts” menu.
Why it matters?
Engagement, whether the type of engagement that implies “acting” on your post by commenting, liking or sharing it, or the type that is just “passive” such as watching the video, zooming on a photo or clicking on a link, is probably the second most important metric to focus on if you are serious about measuring your page’s performance.
It is not enough to be viewed by a lot of people, you need to make sure that what you offer them as content will trigger some kind of interest. And engagement is the only measurable sign of interest.
Expert tip: when measuring engagement, do not focus on the raw number you can see on your insights. The only way to really understand that metric and later compare posts against one another is to compare the number of engaged people with the number of people reached for the concerned post. Exactly like the formula below.
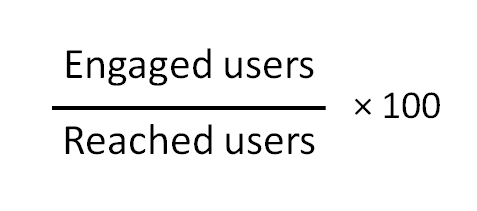
To be able to compare each post engagement metric with other post, the only way is to create a percentage out of it. That way, you get a number that will be consistent post after post and you can benchmark them against each other. If you rely on the raw number of engaged users, you will never know if a good engagement is due to the quality of a specific content or if it was just shown to more people in the first place.
You end up with a percentage that makes real sense because it takes the exposure of the post into account and allows the comparison between posts.

Creating these percentages really help benchmarking posts against one another. In the above example, you can see that the posts that got the highest number of engaged users (19,041 and 15,320) had a very different performance, one representing 23.3% of the reached users (huge!) and the other one only 7.4% (just average).
Facebook metric #4: People creating stories or storytellers (ex. talking about this)
What is it?
The “Storytellers”, called “People Talking About This” in the old insights, represents the people who have liked, commented or shared a post. The engaged users are all the users who have clicked anywhere on your post, the storytellers is the portion of these users who have clicked on like, comment or share.
As opposed to just clicking on a link, a picture or a video, liking, commenting or sharing a post will generate a story that will be published on Facebook for our friends to see.
What makes the “Storytellers” different than the mere engagement metric is that engagement in this case potentially generated a publication by that user showing his engagement to his friends.
Where to find it?
Here again, go to your insight interface at the same place where you spotted the organic reach and the engagement and look at the “Engagement” column after having selected “likes / comments / shares” in the drop down menu. Easy.

Like the “Engaged Users”, the “Storytellers” metric is also easy to spot in your Facebook insights. In the posts menu, click on the top right arrow and select “likes / comments / shares”.
Why it matters?
This is the “viral” metric. Going back to the roots of your motivation for investing on a Facebook page was probably the dream came true that you could connect with the friends of your existing fans for free! A hell of good promise. That metric is the best one to measure how many people are willing to spread the word about you to their friends.
In plain English, if a user likes, comments or share a post on your page, Facebook may publish to his friends that this user (their friend) liked, commented or shared a piece or content from your page. I emphasize the “may” because Facebook is limiting the reach of these stories very seriously. That is probably why if you used to see in your newsfeed that such and such friends had liked, commented or shared a piece of content from a page, you probably see less and less of that today.
So, even f you still need to follow that metric, don’t expect too much from it. Facebook is still the best place to leverage virality, but it’s not the eldorado it used to be.
Facebook metric #5: Clickthrough rate (or “consumption”)
What is it?
Here comes a metric that you are used to! CTR, or Click Through Rate has been around for years on the web and is used to measure the effectiveness of email marketing, banner advertising, search engine ads such as adwords campaigns or landing page quality.
The good news is that it means the same thing within Facebook. This will tell you the number of people who have clicked on a link in your content, watched your video or viewed a larger version of your photo.
Where to find it?
Go to your page insight interface, click on the “posts” menu and you’ll find the number of users who have clicked on your content.

Looking at the “engagement” metric for each of your posts, the post click is shown as a blue bar chart.
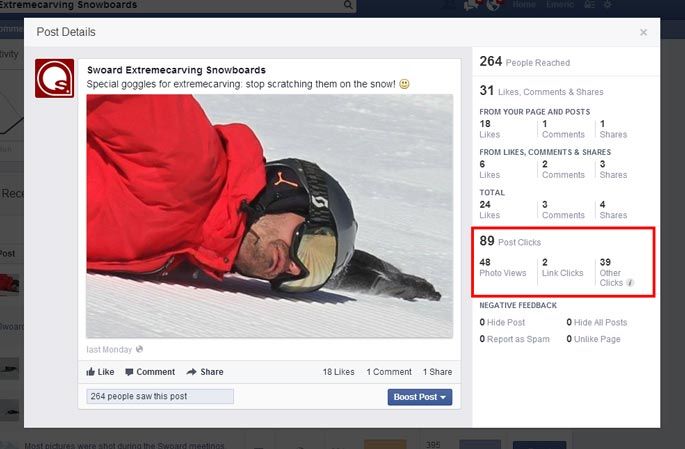
If you want to have the detail of the types of clicks your post has received, click on the post title and you’ll see a pop-up with a lot more details on the type of clicks. Here, you can see that among the 89 clicks the post has received, 48 were photo views.
Why it matters?
It is nice to know how many people have potentially seen your content (the reach metric), even nicer to know how many of them were interested enough to act on it (engaged users), but the bottom line is really to know how many people were actually interested enough to pay real attention to your content. And that means watching your video, looking at your photo or checking out your link.
That is the bottom of your “content quality” funnel. Keep an eye on it.
Facebook metric #6: Negative feedback
What is it?
A negative feedback is a “negative” action taken by a fan on your piece of content. It can be hiding that specific post, hiding all future posts from your page, unliking your page or worse, reporting it as spam. Simply put, it counts the number of users who really did not like your content or the fact that it appeared in their newsfeed.
Where to find it?
Go to your page insight interface, click on the posts menu and look at the “Engagement” column after having selected “Post Hides, Hides of All Posts, Reports of Spam, Unlikes of Page” in the drop down menu.

Like the “Engaged Users”, the “negative feedback” metric is also easy to spot in your Facebook insights. In the posts menu, click on the top right arrow and select “Post Hides, Hides of All Posts, Reports of Spam, Unlikes of Page”.
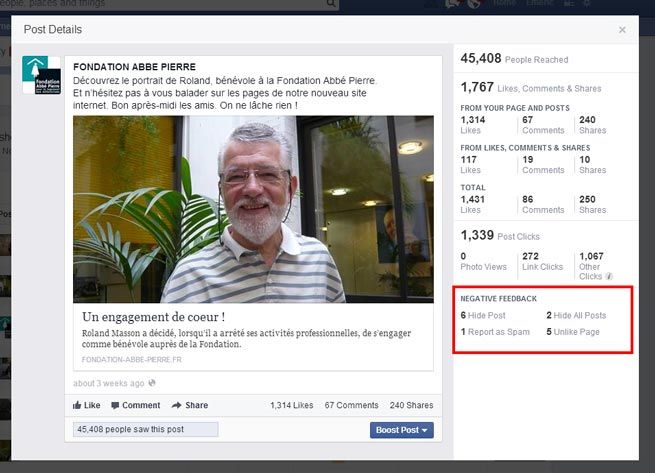
If you want to have the detail of the types of negative feedback your post has received, click on the post title and you’ll see a pop-up with a lot more details on the type of clicks. Here, you can see that among the 14 negative feedbacks received, the post generated 5 unlikes of the page.
Why it matters?
Since September 2012, Facebook has given much more weight to the negative feedback metric. In other words, posts with a high negative feedback will have much less exposure through edgerank and, pages with an average negative feedback that remains high will have less and less reach over time.
Needless to say that if you want to stay in the game of Facebook marketing, you need to keep that number as low as possible.
Expert tip: As with all other engagement metrics (engaged users, ptat, clicks), when measuring negative feedback, do not focus on the raw number you can see on your insights. The only way to really understand that metric and later compare posts against one another is to compare the number of people who gave negative feedback with the number of people reached for the concerned post. You end up with a percentage that makes real sense because it takes the exposure of the post into account and allows the comparison between posts.
Conclusion: measuring you Facebook page performance may seem like a daunting task if you have to do it manually from the Facebook insight interface or the Excel download, but it is good to start doing it that way to really have a feeling of where the data come from and what they mean.
Once you start being familiar with them, you can use third party tools that will help you save time and get right to the point.


