Although Twitter isn’t the most opaque marketing channel in the world – SEO is often harder to understand – it still helps to know what you’re doing. You’re investing in Twitter to turn a profit, after all. It’s business.
And that’s why it pays to watch the businesses that get it right. To make it easy, Simply Measured released an infographic that reveals how – and why – Interbrand’s 100 top brands use Twitter to grow business.
We’re breaking it down into manageable parts today, with quick and actionable takeaways to get you started. Be sure not to miss the entire infographic – everything at once – when you get to the end.
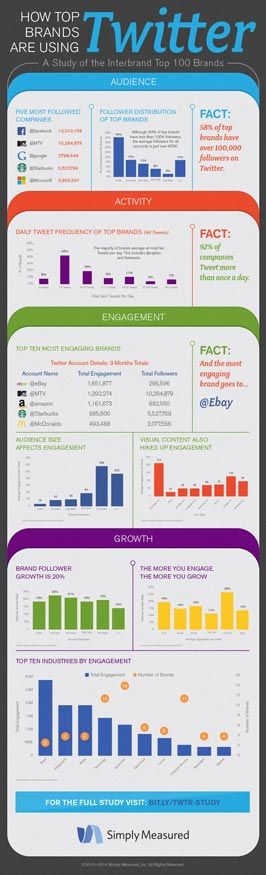
1. Audience
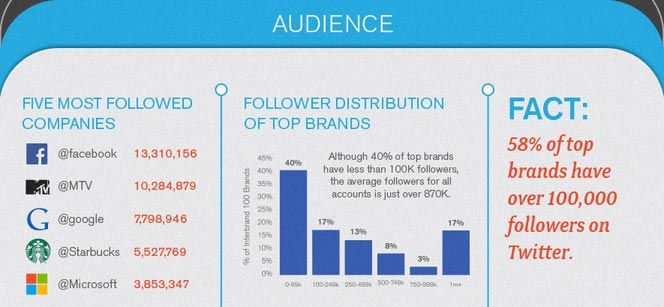
Unsurprisingly, the 5 companies with the most followers are also Fortune 500’s. Also unsurprisingly, they have a lot of cultural cachet. MTV is a fixture in the music entertainment industry and Starbucks is the world’s largest coffeehouse company.
But, check this out- 40% of the top 100 brands have fewer than 100,000 followers.
A correlation between customer base and audience size is there, but it’s not absolute. Those 40% attest to that.
You can do well as a small business too.
[Tweet “As you get more customers, make sure you’re getting more Twitter followers too. They’re related.”]
2. Activity
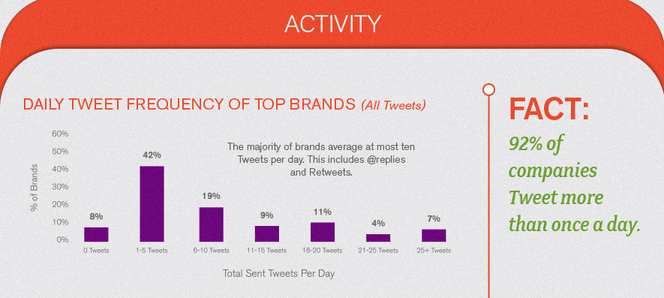
When it comes to social media, activity matters. That’s why 92% of top companies don’t just tweet once a day; they tweet several times a day. And many do considerably more than that.
The takeaway here isn’t hard to see. We have to tweet and do it every day. Thanks to social media management tools, it’s not very hard. The time commitment – even for us small businesses – is pretty small.
[Tweet “9 out of 10 top brands multiple times a day. You should too.”]
3. Engagement
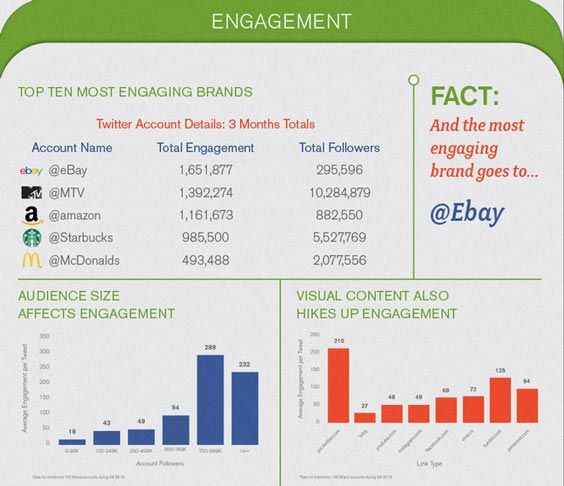
Social meda is, well, social. It’s not a platform for you to just talk at people, but with them. If we just wanted to be heard or seen, we’d spend our money on banner ads instead.
Instead of focusing on how many followers we have and how many people are seeing our marketing communications we perform better when we think about what they’re doing with those communications, too. Are they replying? Are they retweeting?
This infographic suggests trying visual content, to start, and our experience agrees. There’s a very clear relationship between visual content and Twitter engagement. And the larger our audiences are, the more engaging it’s likely to be.
[Tweet “Twitter pictures usually engage more than Instagram ones. When in doubt, go with the first.”]
4. Growth
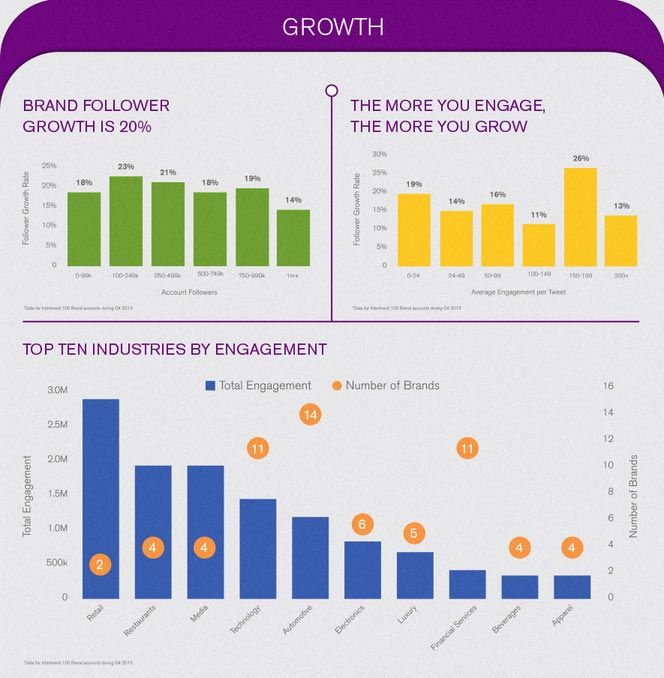
Naturally, we have to think long-term. We want follower growth and we want it as high and predictable as it can be.
There a few things that influence that. The first is how many followers you already have. As you move into the millions, your growth rate will probably decline; you’ve already eaten all the low-hanging fruit. But, you don’t get your strongest growth before the 100,000 mark, either. That comes in the 250,000 to 499,000 range.
Engagement, too, can speed us up or slow us down. The sweet spot is in the 150 to 199 range per tweet. And of course, we have to look at industry. Retail companies are in luck. Among the Interbrand top 100 brands, they enjoy the most engagement, which translates to the most growth.
It’s interesting to note they don’t have many rivals either. 2 of those top 100 brands are in the retail space, whereas 14 are in automotive. And the automotive gets about half as much engagement.
[Tweet “Look at follower count, engagement, & industry to set growth targets for Twitter.”]
At the end of the day, we perform better when we look at our company, and think about our specific products, customers, and rivals not as models, but as living, breathing things.
We can find beneficial similarities between what we and other companies are doing and take a few cues from the major players, too.
That’s a good place to start if you’re new to Twitter marketing.
Are you hurting for followers or out of ideas for engagement? Does your industry really affect how well your business account performs? Let us know in the comments below.
And be sure to read the original infographic at Simply Measured!