

Facebook Insights is an endless database of information that you can use to the benefit of your business. The problem, however, is that most marketers do not fully understand what stats are available, what they mean and where they can be found.
This is the second in a series of posts that will act as a resource to help you master Facebook Insights. The first post helped you understand Facebook Reach. Today, we will focus on those metrics associated with Engagement.
Here’s a little irony for you: Although this post is focused on engagement statistics, I will not be mentioning the Engaged Users metric (except for in this intro). The reason for that is that Facebook has done an adequate job of confusing marketers by creating two nearly identical metrics: Engaged Users and Consumers. The only difference between the two — as far as I can tell — is that Engaged Users includes stories generated without a click.
That said, we tend to put a group of metrics under the “Engagement” umbrella. So the following metrics are all those based on user interaction with your brand (found within web Insights, Page and Post Level Exports, and AgoraPulse).
Stories
Definition: The number of stories generated about your Page post when a user interacts with your content, thereby sharing it with their friends.
From a Page level, this includes…
-
- o
- Liking your Page
o
-
- Posting to your Page’s Timeline
o
-
- Mentioning your Page
o
-
- Tagging your Page in a photo
o
- Checking in at your Page’s location
From a Post Level, this includes…
-
- o
- Liking your Page post
o
-
- Commenting on your Page post
o
-
- Sharing your Page post
o
-
- Answering a question posted by your Page
o
- Responding to one of your Page’s events
Why it Matters: Stories are how your Facebook Fans help you organically promote your Page. Clicking on your content is nice. But any interaction that results in spreading your message to friends is better.
In Web Insights: N/A
In Page Level Export:
-
- o
- Daily, Weekly and 28 Days Page Stories (Key Metrics – Columns E-G)
o
- Daily, Weekly and 28 Days Page Stories by Type (tabs for each)
NOTE: The tabs for Stories breaks it down by type (Checkins, Page Like, mentions, Page posts and user posts generating stories)
In Post Level Export:
-
- o
- Lifetime Post Stories (Key Metrics – Column R)
o
-
- Lifetime Post Stories by Fans (Key Metrics – Column AB)
o
- Lifetime Post Stories by Action (tab)
NOTE: The tab for Stories by Action breaks it down by Comment, Like and Share.
In AgoraPulse: Within the Timeline tab, admins can view the following related to Stories:
-
- o
- List of posts with number of Comments and Likes
o
- Individual comments by Fans and number of Likes they received
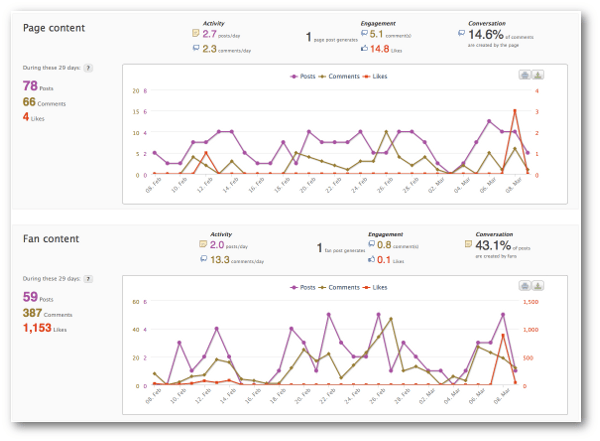
Within the Statistics tab, the following data can be found related to Stories:
-
- o
- Chart for Page Content (number of Posts, Comments and Likes)
o
-
- Chart for Fan Content (number of Posts, Comments and Likes)
o
- Select “Engagement” within list of posts to view table that includes Comments, Likes and Shares by post
Talking About This
Definition: The number of unique users who created a Story about your post or Page (as defined above).
Why it Matters: Maybe you have a concentration of Stories generated by a small number of users. This stat will then give you a better idea of how many fans are helping share your content by performing actions that generate stories.
In Web Insights: Within the Overview tab, Talking About This is within the main chart and the fifth column of the post-by-post table.
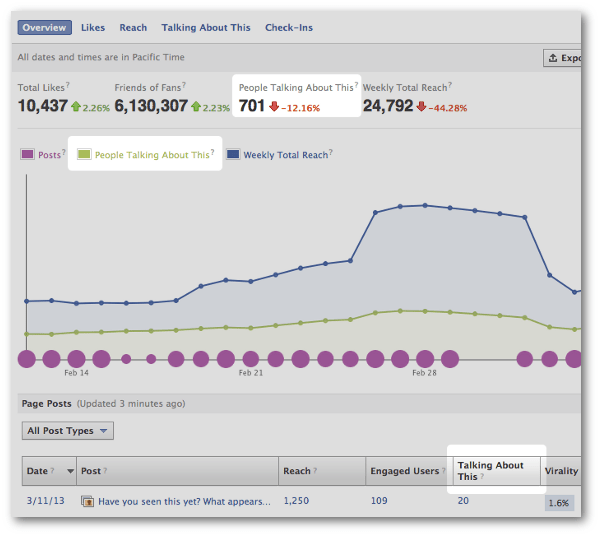
There is also a Talking About This tab that breaks down who is talking about your brand by age, country, city, gender and language.
In Page Level Export:
-
- o
- Daily, Weekly and 28 Days Talking About This (Key Metrics – Columns B-D)
o
-
- Daily, Weekly and 28 Days Talking About This by Action Type (tabs for each)
o
-
- Daily, Weekly and 28 Days Demographics Talking About This by Age and Gender (tabs for each)
o
-
- Daily, Weekly and 28 Days Demographics Talking About This by Country (tabs for each)
o
-
- Daily, Weekly and 28 Days Demographics Talking About This by City (tabs for each)
o
- Daily, Weekly and 28 Days Demographics Talking About This by Language (tabs for each)
NOTE: The Talking About This down by action type breaks the metric down by checkins, number of page likes, number of mentions, number of page posts and number of user posts being talked about.
In Post Level Export:
-
- o
- Lifetime Talking About This (Key Metrics – Column Q)
o
-
- Lifetime Fans Talking About This (Key Metrics – Column AC)
o
- Lifetime Talking About This by Comment, Like and Share (tab)
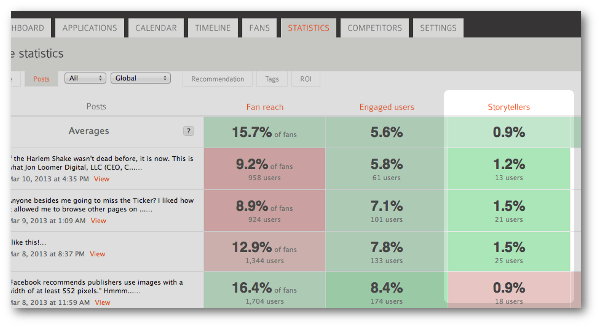
In AgoraPulse: AgoraPulse displays the “Talking About This” metric as “Storytellers.” This can be found as a column within the Posts view of the Statistics tab (both Global and Engagement filters).
Consumers
Definition: The number of unique users who clicked anywhere on your Page or post. This includes clicks that do and don’t generate Stories.
Why it Matters: In my opinion, marketers should be using Consumers rather than Reach in determining the impact of a post. This is the only way to determine how many people definitely saw a specific piece of content.
In Web Insights: N/A
In Page Level Export:
-
- o
- Daily, Weekly and 28 Days Total Consumers (Key Metrics – Columns BO-BQ)
o
- Daily, Weekly and 28 Days People Who Interacted… (tabs for each)
NOTE: The “People who interacted” tabs breaks down Consumers by consumption type (link clicks, other clicks, photo views and video plays). Other Clicks include clicks that resulted in a story.
In Post Level Export:
-
- o
- Lifetime Post Consumers (Key Metrics – Column S)
o
- Lifetime Post Consumers by Link Clicks, Other Clicks, Photo Views and Video Plays (tab)
In AgoraPulse: As mentioned in the intro, Consumers and Engaged Users are nearly identical metrics. AgoraPulse surfaces the Engaged Users metric within the Posts view of the Statistics tab. You can sort posts by Engaged Users while using either the Global and Engagement filters.
Consumptions
Definition: The number of clicks on any of your content. This includes both clicks that do and don’t result in stories.
Why it Matters: See “Consumers.” The Consumptions metric gives brands a clear view into the number of times a piece of content was seen and touched.
In Web Insights: N/A
In Page Level Export:
-
- o
- Daily, Weekly and 28 Days Total Consumptions (Key Metrics – Columns BR-BT)
o
- Daily, Weekly and 28 Days Consumptions by Click Type (tabs for each)
NOTE: The tabs break down consumptions into Link Clicks, Other Clicks, Photo Views and Video Plays. Clicks that result in stories are included in Other Clicks.
In Post Level Export:
-
- o
- Lifetime Post Consumptions (Key Metrics – Column T)
o
- Lifetime Post Consumptions by Link Clicks, Other Clicks, Photo Views and Video Plays (tab)
This article has been written by Jon Loomer. Jon is an awesome Facebook Marketing coach delivering unique and actionable Facebook marketing tips on his blog. Don’t miss his Blog and Newsletter: www.jonloomer.com


