


This is part of a series of blog posts that will be aimed at finding hidden statistical gems that are buried within Facebook Page Insights. The first several parts of this series will focus on the web version of Insights.
During the past few weeks, I’ve been focusing on the Reach and Engagement of your Facebook Page posts. But today I’m going to help you dig into Facebook Insights to get a better sense of the traffic to your Facebook Page: What users are looking at, where they’re coming from and how it compares to your News Feed exposure.
Note that these results are for my Page and do not necessarily suggest what you will see with your own. Many factors contribute to the results I see, and I provide these steps so that you can discover the data associated with your Page.
For the purpose of this study, I used data for the range of August 27 – November 24. I like to use as large a sample size as possible, and the web version of Facebook Insights will not allow you to look at a data set larger than 89 days.
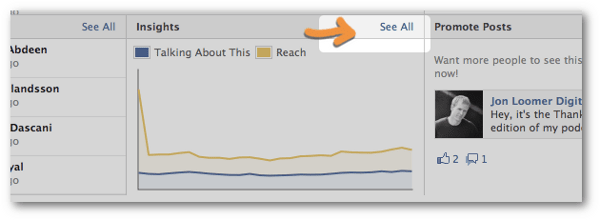
Quick reminder: You can access your web version of Facebook Insights by clicking on the “See All” link within the Insights widget in your Admin Panel.
As a point of reference, let’s first look at the total organic Reach and Impressions of my Page posts during this same period. I found this information within the Page Level Export (columns R and AD).
Total Organic Impressions
1,281,009 (14,393.4 per day)
This includes every post impression within my Page as well as the News Feed and Ticker.
Total Organic Reach
195,436 (2,195.9 per day)
This is the number Page admins are most familiar with.
Note that my Total Organic Impressions are nearly seven times that of Total Organic Reach. In other words, the typical user who sees my posts is being exposed to them seven times each day across News Feed, Ticker and my Page.
Total Page, Timeline and Tab Views
This data is a bit buried, but it is found at the bottom of the Reach tab.
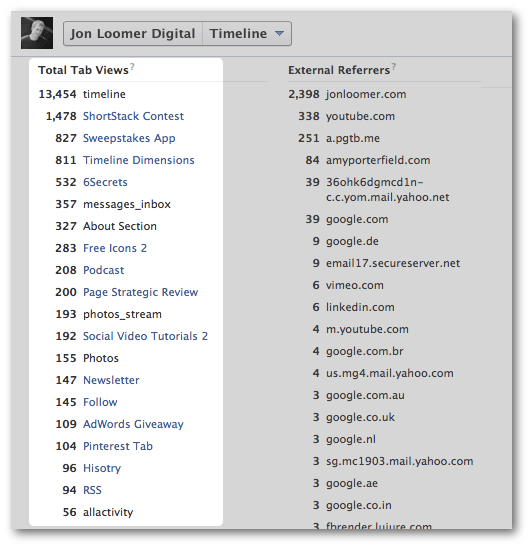
To make sense of this, we have to separate out the data. Facebook includes your Timeline, native apps and custom apps in the same column. But they should be considered independently.
“Timeline” is what it sounds like: The views of your Timeline. Any of the linked items are your custom tabs. The rest are native tabs (private messages, About, Photos, etc.).
Total Page Views: 19,768 (222.1 per day)
This accounts for all of the views associated with your Page: Timeline and all tabs. It does not include any views outside of your Page (like within News Feeds and Tickers).
Important to note that my Total Page Views are only 1.5% of my Total Organic Impressions. Now, Facebook doesn’t make it clear what the differences are between “Impression” and “View,” but certainly interesting when taking these numbers in perspective.
Total Timeline Views
13,454 (151.2 per day, 68.0% of Total Page Views)
Tab Views
Custom Tabs: 5,226 (58.7 per day, 26.4% of Total Page Views)
Native Tabs: 1,088 (12.2 per day, 5.5% of Total Page Views)
Total Tab Views: 6,314 (70.9 per day, 31.9% of Total Page Views)
First of all, no big surprise that I get far more views of my custom tabs than the native tabs. Other than Photos, I bury the rest and emphasize my custom content.
It’s also important to point out that I conducted two contests during this period that account for 44.1% of my total custom tab views. There are several factors that can increase tab views, and this is one of them. Another would be if you regularly have ads that direct people to your custom tabs.
So numbers for tab views can be drastically different depending on the emphasis you have been putting on this real estate.
External Referrers
This is the number immediately to the right of your Total Tab Views.
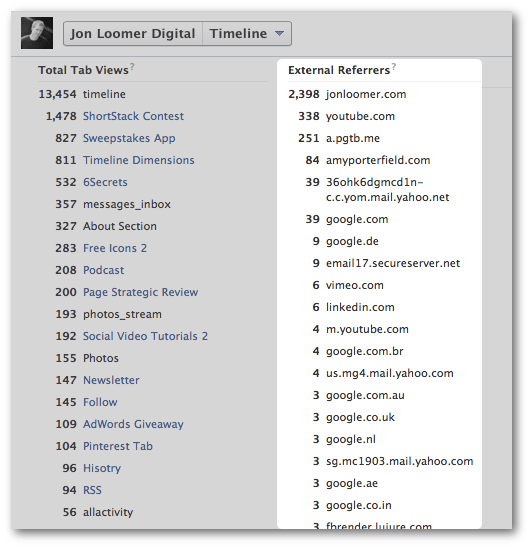
This represents any traffic to your Facebook Page referred by an external website. No surprise that JonLoomer.com accounted for 74.7% of my referral traffic. I also likely control all of that YouTube referral amount, which makes up another 10.5%. More evidence that you need to cross promote!
I’d like to see more referral traffic from Google. This low number is a sign that I should spend more time looking at the key words on my About page.
When added up, I received a total of 3,212 referrals (36.1 per day) during this 89 day period. We can then determine that of the traffic on my Facebook Page, 16.2% was referred.
Like Sources
Ever wonder where your Fans decided to Like your Page? You can see that.
This data is at the bottom of the Likes tab. Once again, I use an 89-day range.
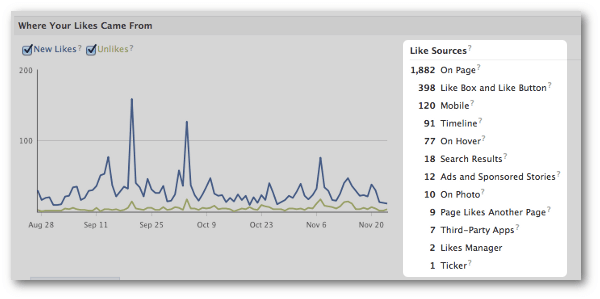
That’s a total of 2,627 new Likes during that 89 day period. Most (71.6%) of the Likes were performed on my Page itself while 15.2% came from my Like Box and another 4.6% Liked my Page from mobile devices.
Looking at this list, I control the vast majority (93.5%) of content that referred traffic to my Page. The fact that I get 4.5 new Likes from my website every day is more evidence that it’s important that your website and Facebook Page work closely together.
What It All Means
So, what does all of this data mean?
Again, it will mean something different for you than it does for me. But these are highlights of what I observe:
-
o
- Page Views are 1.5% of Total Organic Impressions
- Custom Tabs make up 26.4% of my Total Page Views
- Of my Page Views, 16.2% is referred
- Content I control directed 93.5% of referral traffic to my Page
o
o
o
My key takeaways?
First, the primary focus needs to be on the News Feeds of Fans. That doesn’t mean that you neglect your Page by any means, particularly since that is the main source of Likes. But more often than not, that’s where they’ll see your content.
Second, take care of what is in your control! Custom tabs and ads generated more traffic to my Page. My website and YouTube generated a high percentage of referral traffic. If you don’t send people to your Page, who will?
What do you see in your data?
If you want to know what the new Facebook Page Insights will do for you and what they won’t, read this newer article.
This article has been written by Jon Loomer. Jon is an awesome Facebook Marketing coach delivering unique and actionable Facebook marketing tips on his blog. Don’t miss his Blog and Newsletter: www.jonloomer.com


