


Note: this article has been previously published on Jay Baer’s blog, Convince & Convert, as a guest post.
For over a year, rumor has had it on the web that Facebook Page posts reach an average of only 16% of fans. Actually, Facebook itself started this rumor in February of 2012 at the Facebook Marketing Conference in New York.
This famous figure of 16% has been repeated again and again on all social media blogs so that it is now perceived as an uncontested truth by virtually all Facebook page administrators.
But the reality is quite different!
Your posts don’t reach exactly 16% of your fans, but most likely a little more or a little less — sometimes a lot more or a lot less!
This 16% figure is the average of data from millions and millions of pages of very different types, it is a myth!
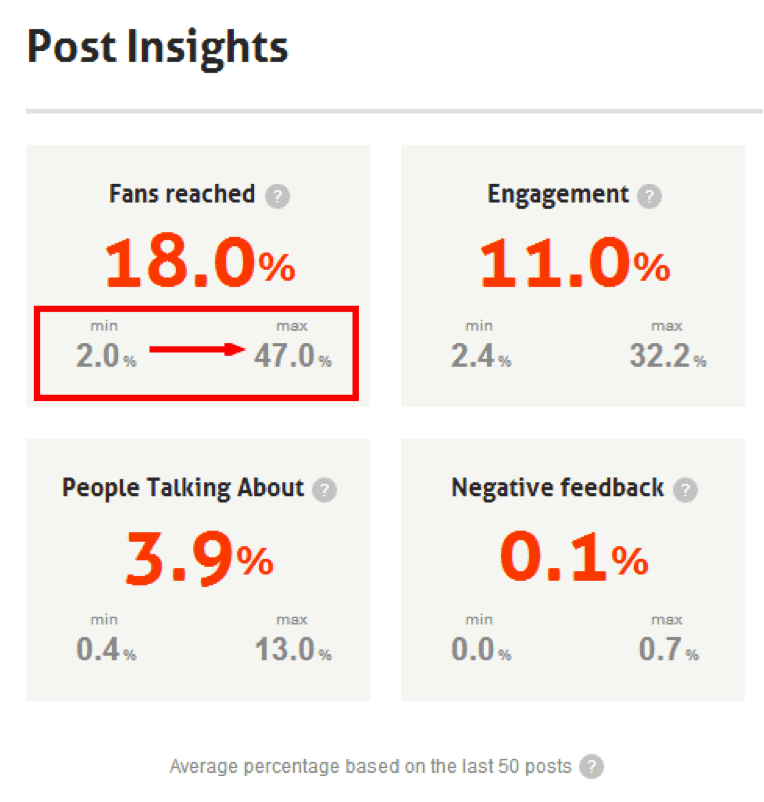
The real figure is somewhere between 2% and 47%, quite far from 16% for everyone…
Let’s take a moment to look at the different forms of measuring reach on Facebook pages. In my experience, there are still many Facebook page administrators who don’t fully understand these metrics. It’s necessary to recognize that understanding them is not always easy. Let me try to clarify this point.
The different types of Facebook reach metrics
Fan reach
Fan reach simply corresponds to the number of fans of your page who have seen any given post. This reach is called “organic”, which means that it only records the number of people who saw your post because they like your page and not because of an action of a friend (such as like, share, or comment).
The Fan only reach metric is not available in the Facebook statistics interface. Fan reach will only be available in the Excel file available for download. You’ll find it under the label “Lifetime Post reach by people who like your Page”. Not as user friendly as the web interface.
Organic reach
Organic reach corresponds to the number of people, fans and non-fans, who have seen a given post. Organic reach only records views which are not the result of a friend’s action (such as like, share, or comment). The views that are a result of an action of a friend are actually recorded in “viral” views. The real difference between fan reach (above) and organic reach is that the latter include views of people that are not fans of the page but have directly accessed your page on Facebook or seen its content in a widget (for example, a “like box” on your site or blog).
So, for lack of being able to see fan reach in the Facebook interface, organic reach can serve as a substitute data point.
On the other hand, it won’t be exact and in some cases could even be quite different from the fan reach.
In the two examples below, we found differences between these two metrics that range from a few percent to more than 100%!
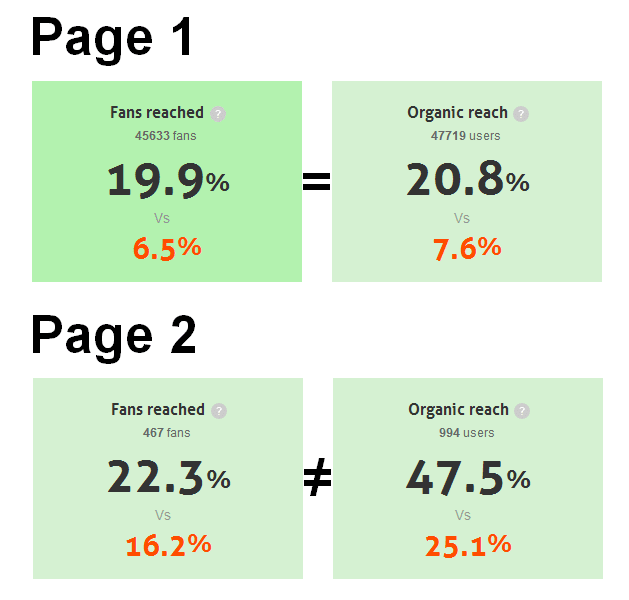
From one page to another, the difference between scope and organic reach can go from small to one more significant (more than double here). If you use organic reach as a reference measurement, make sure your page is closer to the former than the latter!
Viral reach
Viral reach corresponds to the number of people who have seen one of your posts from an action taken by one of their friends (like, share, comment). We assume that the metric records fans and non-fans in the absence of a more specific definition from Facebook.
The viral reach is therefore the most immediate translation of Facebook’s implicit marketing promise: “recruit and engage in conversation with your fans so they talk about you with their friends.”
Paid reach
No need for a lengthy definition – this is simply reach obtained through paid means, such as promoted posts and advertisements (sponsored stories). This paid reach can come from fans or non-fans.
Total reach
Total reach is the sum of organic, viral, and paid reach. That one was easy!
But the complexity doesn’t end there. Beyond the type of reach (organic, viral, etc.), Facebook also allows for different time periods to be measured. Fan reach — organic, viral, and paid — can therefore be measured over multiple periods.
Different “periods” of measuring the reach on Facebook
1 – Post reach
This is the fundamental unit of measurement. It’s also the one used in the context of our discussion of the “16%” myth. It measures the number of people who have seen a particular post. It is the most important measurement because it lets you compare posts to each other without regard to how frequently you post them. It is not actually a “period” of time but assume that it’s the basic unit for measuring reach.
2 – Daily reach
This is the number of people (fans and/or non-fans) that the page reaches each day. This metric is relevant if you publish every day and publish the same number of posts every day. I personally don’t find this metric so interesting because it represents little and is too heavily influenced by post frequency.
3 – Weekly reach
This is the number of people (fans and/or non-fans regardless of whether they are organic, viral, or paid) that the page reaches each week. This metric is therefore influenced by the average reach of each post and also by the number of posts published each week.
4 – Monthly reach
Same definition as the weekly reach, but here the measurement is made over the last 28 days. Right behind post reach, this is my second favorite metric because it shows me the total number of people who have seen the page content at least once in the previous month.
What you must remember: Post reach is the only good indicator of the quality of your content and good health of your page because it is not influenced by the frequency of your posts. On the other hand, weekly reach, or even more so, monthly, is a good indicator of the visibility of your brand over a given period of time. Facebook users are not permanently connected and cannot see all your posts. That’s why it is interesting to see the percentage of fans reached over a given time period, especially to have an approximate idea of the percentage of fans with whom you have completely lost touch. The percentage of fans that haven’t seen your posts over a month is probably a good estimate of the percentage of fans who no longer see your posts at all.
Why is « per post » fan reach the most important metric for follow?
Per post Fan reach is probably the most important metric. Its importance is due to being a key indicator of the appeal of your content to your audience and the quality of said audience.
An audience recruited from an eye-catching contest (or worse, bought by the thousand from sites with practices as questionable as their effectiveness) will quickly hide your posts from their newsfeed. If they don’t actively unsubscribe, their lack of interest, and therefore disengagement, will cause them to be effectively unsubscribed from your publications due to the relentless effect of Edgerank.
Fan reach is a key indicator of the health of your Facebook page. The higher the quality of your audience and the more interesting your content is, the greater the increase in percentage of fans reached will be — and vice versa.
There was a time when Facebook put this metric at the forefront by displaying it very clearly on each post.
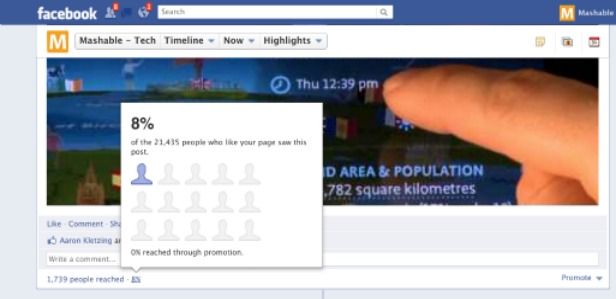
A few months ago, Facebook displayed the percentage of fans who saw each of your posts. This feature has quickly disappeared. That’s too bad.
This feature has disappeared. Personally, I don’t really understand why it had such a short lifespan, just a few weeks.
In any case, this metric is the basis of the famous “16%” and it is the one that interests me today.
More attention must also be given to post reach than other measurements (daily, weekly, monthly reach) because, for example, a high frequency of posts to an mildly interested audience will give you a daily reach which could seem correct but is artificially “bloated” by the sheer number of posts.
You can post more on a daily or weekly basis to reach more people, nothing to be blamed about, but it only makes sense if each individual piece of content resonates well with the audience. Trying to post more often to hide a low performance per post is not a strategy I recommend.
Let’s take a look at the factors that can influence this reach percentage.
What factors can influence your average reach per post?
In Facebook land: small is beautiful!
The smaller your page is, the higher percentage of fans you will reach. According to statistics that we have based on more than 3,000 Facebook pages, those with less than 1,000 fans reach on average 22% of their fans per post while pages with more than 100,000 fans reach an average of only 6.6% of their fans with each post.
This is a ratio of 3.5 to 1! You can already see that the 16% average figure makes no sense because if your page has 1,000 fans, a good comparative average is 23%. If your page has 150,000 fans, it is closer to 6 or 7%.
Small or large, not all Facebook pages are equal
The differences in Facebook page’s reach isn’t just about their size. Even within the same size range, the gap between the best and the worst is absolutely astounding.
For example, pages in the range of 100,000 fans have an average fan reach of 6.7%. However, the average of the worst 5% performing pages shows a reach of 0.6% of fans (oops!), while the top 5% performing pages reach an average of 20% of their fans with each post. Wow! The best pages reach, therefore, 3 times more fans than the average on a percentage basis!
We went a step further and examined the figures for the top 5% performing pages. Among them, THE top performing page reaches up to 29% of its fans with each of its posts. Impressive! This means each post of this page that has 100,000 fans reaches almost 30,000 people on average every time it posts something…and that is without any paid advertising.
It is absolute proof, if it were still needed, that Facebook does not play with the reach of pages to force them to pay for advertising. An effective page still enjoys phenomenal reach without paying a dime.
What percentage of your fans can you expect for each of your posts?
As mentioned above, the 16% figure embraced by the blogosphere for nearly a year makes no sense and most likely does not apply to your page.
Then, if you would like, you can install the application to measure the average reach of your page (fans, organic and viral). You have to install the app but it will save you the trouble of having to calculate it manually.
So is your average fan reach closer to 2% or 45%? Please share your results in the comments — I look forward to helping you analyze and improve them!


