

This is part two of our three post series on social media ROI. Last time we looked at how to measure your audience. Now we’ll look at the best ways to measure the amplification of your messages.
Amplification is a fancy word for shares. When people share your content they are amplifying it, showing it to an audience that you may not reach on your own.
I always liken amplification to word-of-mouth marketing. People may not be endorsing you directly, but they are spreading the word about you when they share your content.
The value of amplification doesn’t just lie in the number of shares but also in who is sharing it and how much they influence your buyers.
Related Post: Social Media Marketing 101
What You Should Measure?
As you will see later on, there are lots of metrics that you can measure but the key ones for amplification are:
- Number of social network shares of your posts
- Number of social network posts linking to your website
- Number of shares from social buttons on your website
Measuring Twitter for Amplification
Twitter Analytics
From the analytics dashboard, click on ‘Tweets’ in the top menu bar.
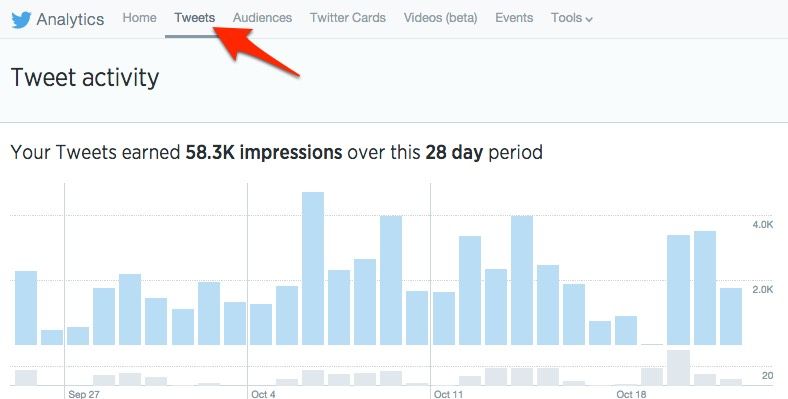
Click ‘Tweets’ to find out more about your most shared content.
On the right-hand side, you can see headline statistics about your RTs. As you can see, I have received 58 retweets in the last 28 days with a peak over the last three days.
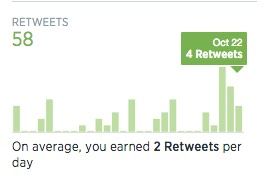
View the number of retweets over the last 28 days.
Click ‘Top Tweets’ to view your most popular tweets.
To dive deeper into these statistics, download a csv by clicking ‘export data’ at the top right-hand side of the screen.
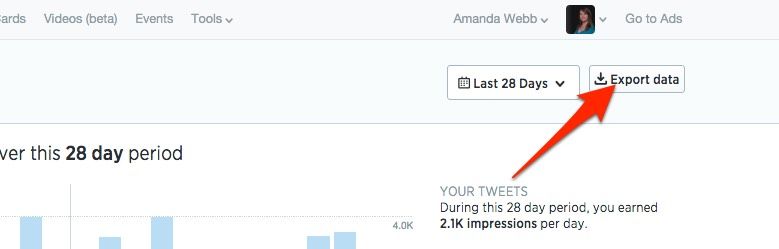
Export your data to delve deeper into your analytics.
Open this file in Excel and you start examining the data in more detail.
My first step is always to sort results by retweets and link clicks.
To easily see the retweets related to my business, I highlight any pointing to my own properties. These include my websites and YouTube channel.
From this I can see that I have driven a total of 11 clicks to my sites from these retweeted tweets.
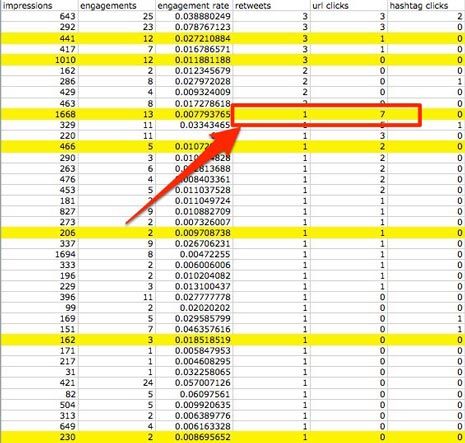
Analyze the data to see the tweets with most retweets and link clicks.
One tweet stands out: it only received one retweet but generated 7 clickthroughs. Time to look at this tweet in more detail.

View popular tweets to analyze their success.
Now I know who was behind the epic retweet that drove traffic to my site: Take a bow Darragh Doyle!
Of course the number of clicks may not correlate to that user at all. Perhaps the wording of the tweet was effective, or perhaps it was the hashtags I used. Even so, it’s worth putting Darragh on my influencers list. The tweet reached 1,668 users as a result of both my tweet and his retweet.
It’s not just clicks to my own website that are important. Anything that I tweet that gets shared is adding to brand awareness and the amplification of my message.
The tweet above got the most link clicks out of all the retweets but the second most clicked tweet also only got one RT. Interestingly, it also reached far fewer people. Whereas the tweet to my site shared by Darragh reached 1,668 people the second one only reached 329.

Some tweets do well even if the reach is small.
My guess is that this tweet was popular because of the wording and timing of the tweet rather than the power of the retweet. This tweet relates to a campaign from a charity. Perhaps I should be more charitable in future.
Twitter Search
Twitter analytics tells you about retweets. But what do the analytics tell you about people who share links to your website that don’t retweet or include your username? To find out how many people are sharing links to your website, go to Twitter search and search for your domain name.
In the example below, I searched for ‘spiderworking.com’
Click on the ‘Live’ tab to see tweets mentioning any link to your website in chronological order.
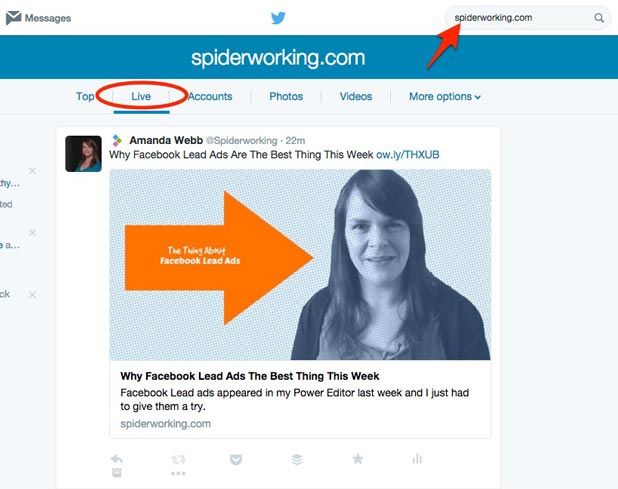
Use Twitter search to find people sharing links to your website
This is a great free way to keep an eye on people sharing your content. The downside is you have to do it manually every time.
If you want something more automated, try AgoraPulse. There, you simply on your Twitter bio on the left-hand side and select ‘Monitoring’.
To set up a search for mentions of your website click ‘Searches’ on the right-hand side.
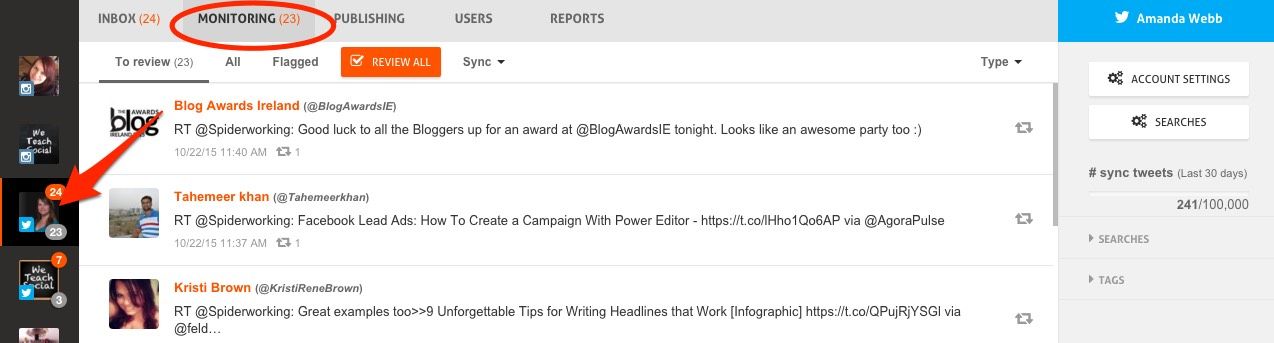
Monitor mentions of your website using AgoraPulse.
When a window appears, click the pencil next to ‘Website.’
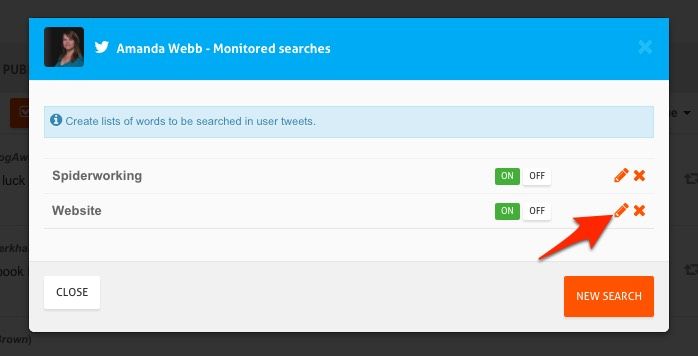
Click the pencil to edit your search.
Now enter the name of your website (no need to add the https:// or the www.) and save.
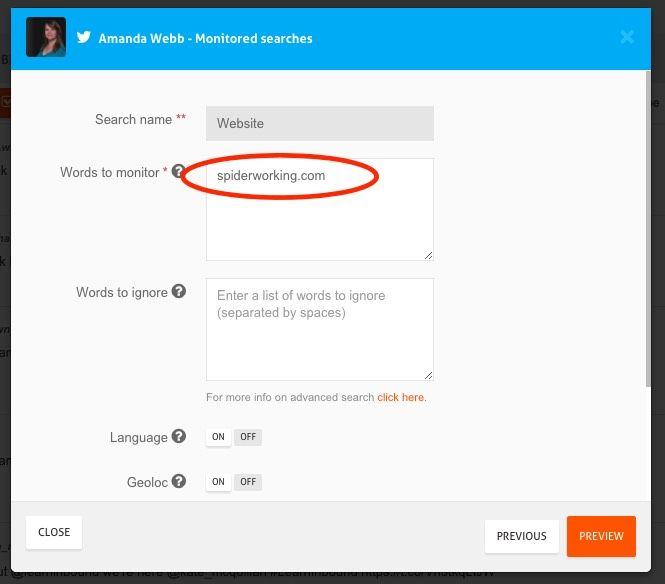
Enter the link to your website and save.
Once you have set this up, any Tweets linking to your website will appear in the monitoring tab.
Measuring Facebook For Amplification
It’s harder to measure Facebook than Twitter as it’s not a public network. Many users will share your content on their profiles but unless their privacy is public we won’t be able to find them.
It can even be hard to find public posts that share your content. Facebook search doesn’t always produce the results we expect. We may see an improvement with the new Facebook universal search.
Facebook Insights
Facebook Insights will show you how many people have shared content from your page over a set period of time.
Click on ‘Engagement’ from the dashboard and select ‘Shares’ from the ‘Like Comment & Shares’ menu.
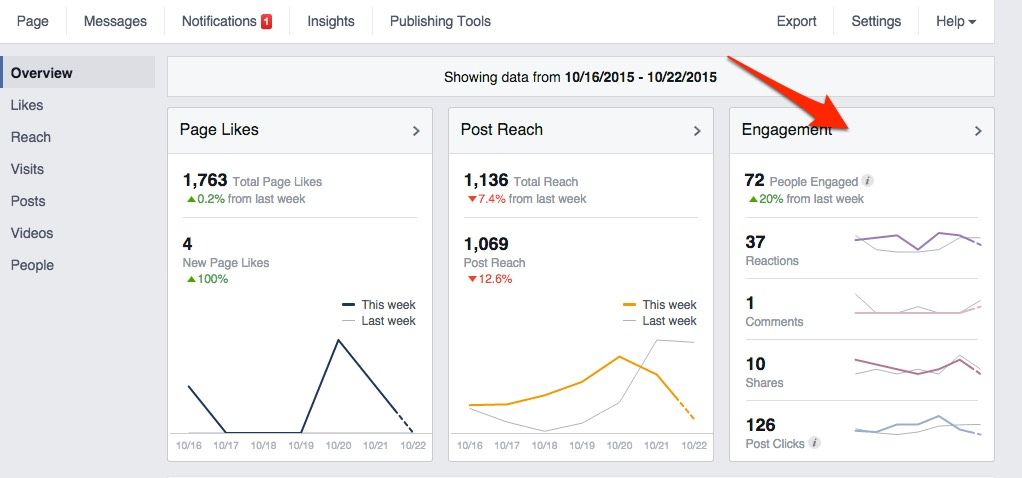
Facebook Insights shows you how many shares your content received.
This shows you the total number of shares and your average daily share rate.
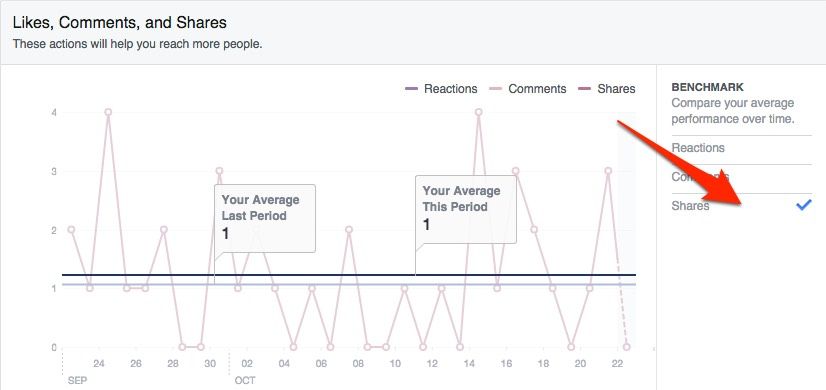
Facebook Insights shows you your share rate and your benchmark share number.
You can download a report to delve deeper. Click ‘Export’ at the top of the Insights window. And select ‘Post Data’. This will give you an Excel document.
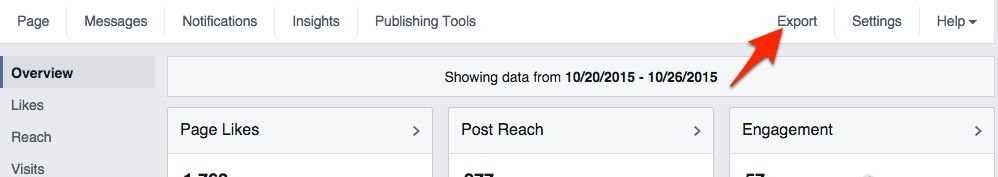
Export your Facebook Insights data.
As we are interested in shares, select the ‘Lifetime talking about this’ tab from the document.
As with the Twitter export I’ve sorted the result by ‘shares’, “comments’ and ‘Likes’. I’ve highlighted any content that I have created from the list.
This shows me not only the number of shares but how many of these are on my own content.
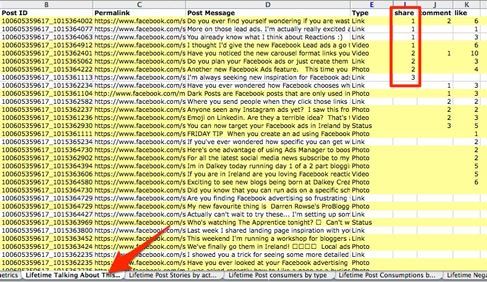
Analyze your Facebook data for shares.
As with Twitter you can investigate your most shared post to see who shared it.
It turns out this was my top shared post and it was first shared by a customer. I’ll have to make a note to reward them for their loyalty.
My most shared post in the last 28 days according to Facebook Insights.
AgoraPulse
There’s some really nice visual reporting in AgoraPulse that makes it much easier to get an overview of how ‘viral’ your page is.
Select your Facebook page from the sidebar and click the ‘Reports’ tab at the top of the page. Now select engagement.
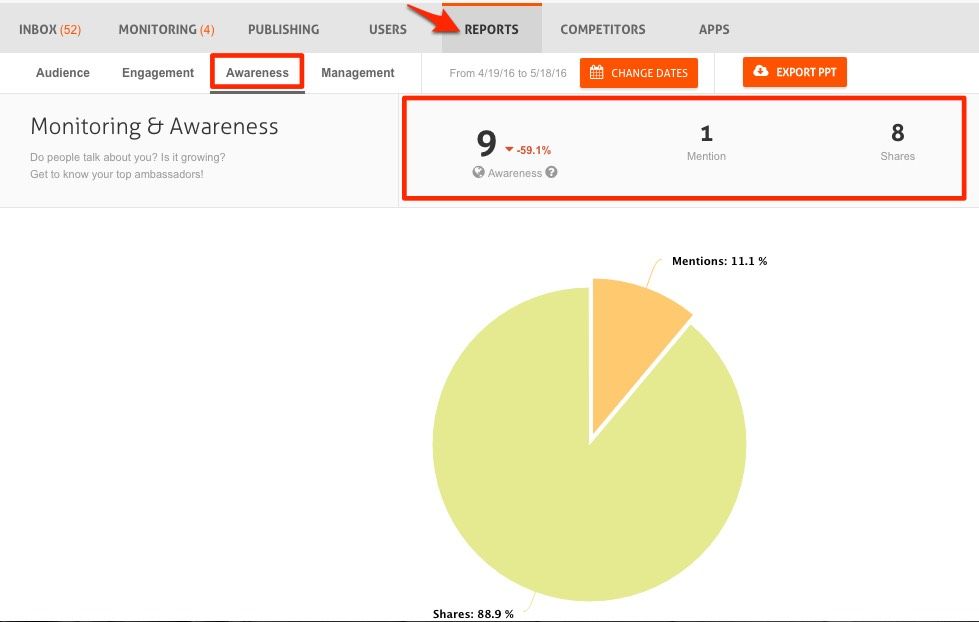
Use AgoraPulse to find out how many people are mentioning and sharing your Facebook page and post
Straight away I can see that I’ve had 9 public posts published about my page by Facebook users in the last 30 days. This includes 8 shares and 1 mention.
If I scroll down I can see that ‘Be Dynamic – Sandra Hennessy’ was my top ambassador, she’ll be the one responsible for that mention in my stats.
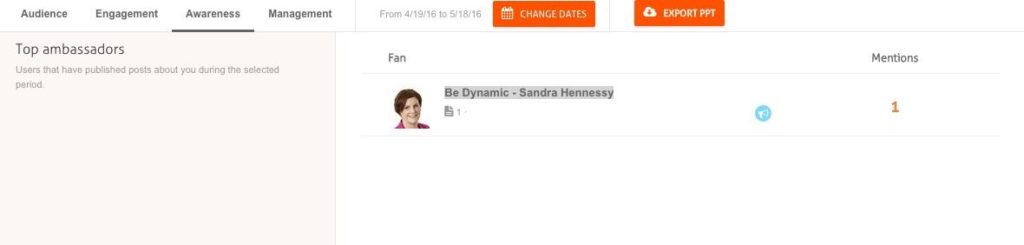
Identify your ambassadors, the people who share your posts and mention you the most.
Measuring Your Website For Amplification
BuzzSumo
BuzzSumo shows you the most popular content on your website. Although you can’t measure the exact number of shares over a specific period of time it will give you an idea of your top content.
Plug your website link into the toolbar to find your top shared content. I found it interesting that mine bears little correlation with my top trafficked blog posts.
This may seem disheartening but a share brings more value than just clicks to your website. A share puts your brand in front of more eyes. If the right people are sharing, you have the potential to reach more of your customers.
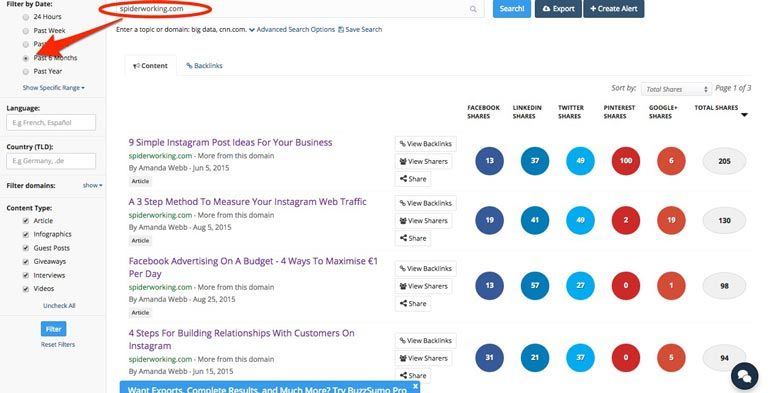
BuzzSumo shows you your top shared content.
SumoMe
SumoMe is a WordPress plugin that makes sharing posts and pages from your website easy.
It also shows you how many times those sharing links have been clicked in the past week (or longer if you upgrade to one of their premium plans). It breaks down shares by network. In the graph below, the light blue bar represents Twitter, the dark blue Facebook, and the red Pinterest.
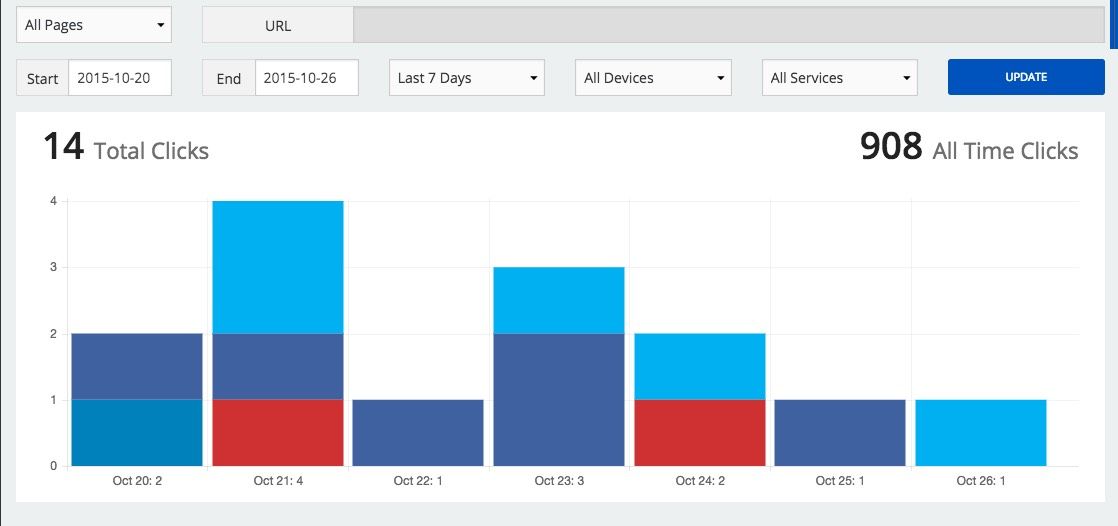
SumoMe shows you how many times the sharing buttons have been clicked on your site.
Google Analytics
SumoMe’s free plan doesn’t integrate with Google Analytics but other sharing plugins do, including the one we use on the AgoraPulse site ‘Flare’.
To discover how many shares you have had via a compatible social plugin, visit your Google analytics dashboard.
Select ‘Acquisition/Social/Plugins’ to see how many people have clicked your share buttons.
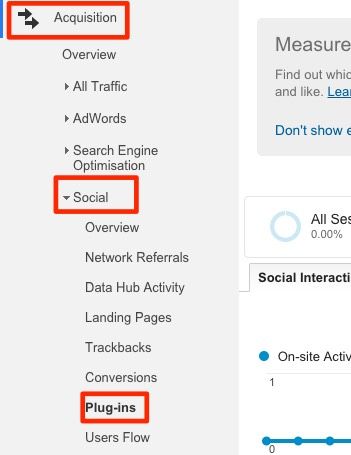
Find out how many shares you’ve had using Google Analytics.
What To Do Next
Add the metrics that are relevant to you to a spreadsheet document and track them weekly or monthly to assess your growth over time.
You may also want to keep a note of the content that is performing the best and try to analyze why. If you find a trend in your most shared content, look at creating similar posts in the future.
I’ll be back with part three of this series shortly. We’ll be looking at how you can measure leads.
Do you use any tools to measure your amplification that I have missed? Tell us about them in the comments!


