

I probably don’t have to give alot of background for this blog post — most of you have heard over the years how Facebook Reach is on the decline.
And some even called Mark Zuckerberg’s announcement about news feed changes the “Facebook Apocalypse“!
But is all of this hysteria true? Or just people panicking due to the possibility of lower Reach?
Comparing Facebook Reach from 2017 to 2018
This “experiment” will be different from our others.
- No Hypothesis
- No Test to Setup
- No Test to Run
Because luckily for us we have some data to look at to give us a true historical view of Facebook Reach.
And that’s through our Facebook Barometer.
It’s this insanely powerful — and FREE — tool our team built a few years ago to get a gauge of how your page stands against similar pages, and to see how your Reach has changed.

With it you can quickly connect all of your Facebook pages and benchmark them.
Currently there are almost 30k pages connected to the app — which means we have LOADS of data to pull and dig through!
Lisa Kalner-Willams, our current Product Marketing Manager at Agorapulse, did some investigating back in March of 2017 and dug through data for nearly 3000 Facebook pages to see what Reach was like for them.
In reality she sifted through probably 26,000 pages and then narrowed down to the top 10 performing categories. She also removed many anamolies (or outliers) that might skew the numbers.
From that post she came up with this really informative infographic:
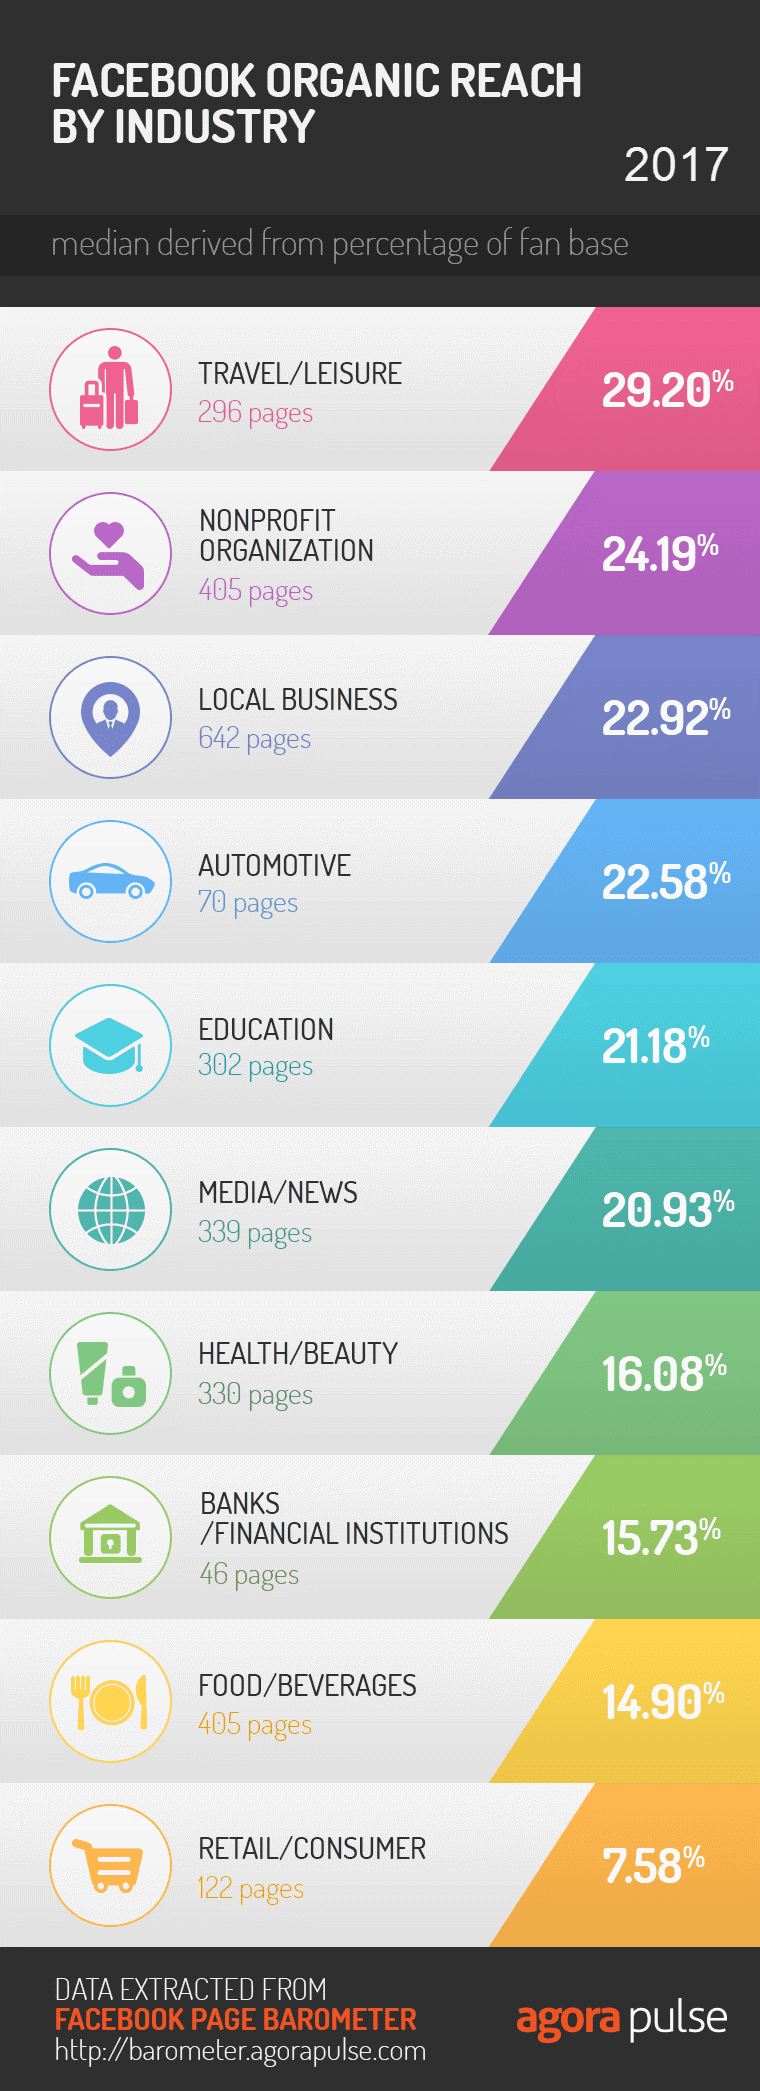
Piggy backing off of this information and the data she pulled I wanted to find out if Facebook Reach would be lower or not. Most assume it is, but not many are pulling detailed data to prove it.
So we’ll do that for you!
Digging Through the Data of 29,000 Facebook Pages
Right off the bat let me tell you that staring at spreadsheets for a few days is no picnic, but the data is intriguing!
While the infographic above from Lisa’s previous research is great I couldn’t use those numbers to compare to 2018 numbers.
Why?
Lisa did a fantastic job at removing many outliers from the data — things like way over performing pages or way under performing pages.
This helped her achieve a true median number.
But, I couldn’t use these numbers to compare to 2018 numbers unless I removed the same exact pages from the data.
Which was impossible — some of them are no longer connected to the barometer or have been removed from Facebook all together.
Luckily Lisa had data from before removing the outliers for me to look at !! Whew…
So here are the non-adjusted Organic Reach numbers from 2017:
- Automotive: 32.45
- Banks/Financial Institutions: 19.53
- Education: 28.28
- Food/Beverages: 17.67
- Health/Beauty: 20.39
- Local Business: 29.47
- Media/News: 30.48
- Non-Profit: 29.74
- Retail/Consumer: 23.99
- Travel/Leisure: 27.11
You’ll notice the differences compared to the infographic — but remember we’re gonna look at unedited numbers from 2018 to compare.
Check out the Reach for each category in April 2018 with the comparison to Reach in March 2017:
- Automotive: 30 – down 7.55%
- Banks/Financial Institutions: 18.63 down 4.61%
- Education: 19.83 down 29.88%
- Food/Beverages: 17.97 up 1.7%
- Health/Beauty: 19.66 down 3.58%
- Local Business: 29.86 up 0.40%
- Media/News: 20.37 down 33.17%
- Non-Profit: 23.24 down 21.86%
- Retail/Consumer: 20.08 down 16.30%
- Travel/Leisure: 21.31 down 21.39%
Evaluating The Data
You can see that some categories like Education and Media/News suffered the biggest drops, which isn’t surprising based on newsfeed changes on Facebook. And the focus on “Fake News”.
I was a bit surprised to see Food/Beverages had a slight increase in Reach, but when you consider those pages tend to also be restaurants, bars, etc where people check-in or take pictures of their food that’s not too shocking. And great news for those in the food industry.
Overall Facebook Reach was down 13.62% for the categories combined.

While the Reach was only slightly up for the Local Business category this one excited me the most.
The vast majority of pages on Facebook tend to be local pages. People know the owners, employees, etc. It’s great to see they haven’t suffered a massive decrease as feared by many.
As someone who owns a local business this is great news! And if you own a local business this should help ease some of your stresses.
Final Thoughts on Declining Facebook Reach
Obviously we don’t have every page on Facebook connected to the barometer, but with nearly 30k pages it gives us a pretty good idea on trends across the board.
Your page might be doing worse or better depending on your strategies and fan base.
What I truly take away from this is while Facebook Reach is definitely lower today compared to late 2016 just a decrease of 13.62% things aren’t as bad as everyone thought.
So maybe this isn’t the Facebook Apocalypse afterall!!
We discussed this decline in Facebook Reach recently on the Social Media Lab LIVE show! Go watch!


