

Do you regularly measure your Website conversion based on referrals from your social media outposts? You know you should. So we’ll show you how.
By the way, is the third and final part of our series on measuring your social media ROI.
In Part 1, we looked at measuring your audience.
Part 2 gave you ways to measure amplification.
I talk to a lot of people who anecdotally know that they make sales via social media. I used to be one of them. It wasn’t until I started measuring that I was able to identify which social networks were working and where to invest my time.
Analyzing your statistics is something you need to do regularly. Social networks change. A social network that used to work well for you could tweak it’s algorithm over night making it less effective. I look at my headline metrics once a week but I’d recommend doing a deeper dive at least once a quarter.
Related Post: Social Media Marketing 101
Measuring Traffic To Your Website
Google Analytics
It’s always satisfying to log into Google Analytics and see the amount of traffic coming into our sites. But when we break down these statistics, we often find that some traffic sources are more valuable than others. Google Analytics allows us to track the amount of social traffic coming to our websites but it also allows us to evaluate it.
How to find out how much traffic Social Media is sending to your site.
(To find this information, you must have Google Analytics installed on your website.)
- Log into the dashboard.
- Click the ‘Acquisitions’ tab on the left-hand side of the screen.
- Select ‘Social’ and then ‘Network Referrals.’
The example below is from my own site. As you can see, Facebook drives the most traffic to my site but it’s the traffic that comes from Twitter that stays the longest spending over double the amount of time on site as Facebook users. They also look at slightly more pages than visitors from any other social site.
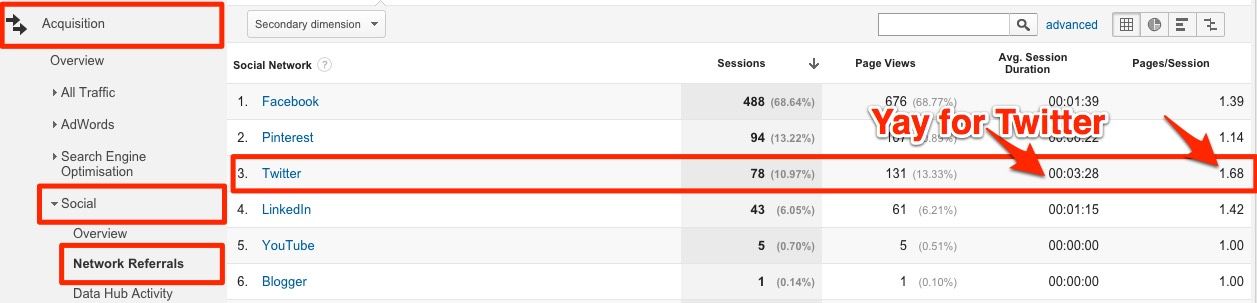
Which networks are driving traffic and how long do they stay on site?
This suggests I should spend more time and advertising on Twitter than I do already.
To delve deeper, add a secondary dimension to these statistics.
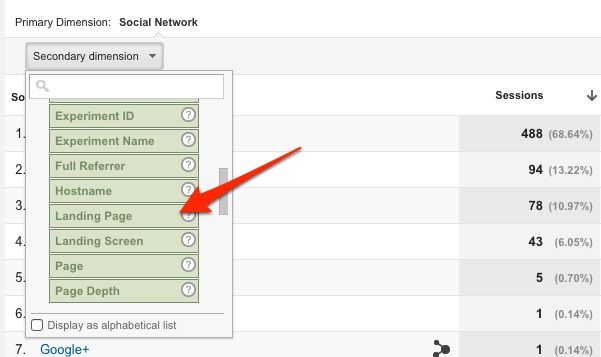
Add a secondary dimension to find out more details.
In the example below I have chosen ‘Landing page.’ This shows me the blog posts that have driven the most traffic.
Keep a note of these posts as you can share them again on your social networks driving more traffic.
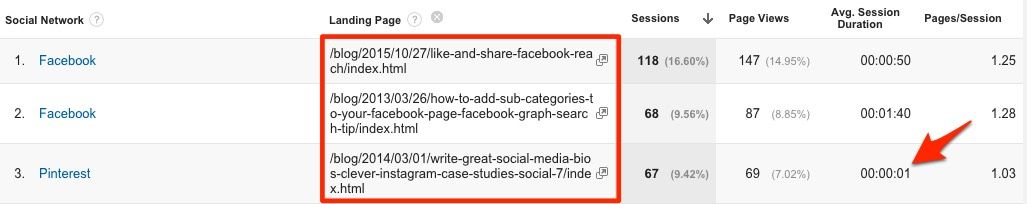
Make a note of top performing posts.
Once other insight that this report gives me is that my Pinterest traffic is very bouncy. Even though Pinterest is driving traffic to one specific post, it looks like it’s not staying very long.
Having flagged this problem I looked at the image that was driving this poor quality Pinterest traffic.

This image was driving lots of traffic but wasn’t delivering what people expected when they arrived on site.
As you can see I’d used a generic but attractive image. This would drive clickthroughs but wasn’t delivering what Pinterest users expected when they arrived on my site. No wonder site visitors didn’t hang around.
Armed with this information I’m now creating more Pinterest friendly images that include the headline of the post on the image. I’m hoping this will have a positive effect on the traffic I get from there in future.
Google URL Builder
I recently ran a set of ads on Facebook pointing at a landing page on my website. As always I created two Ad Sets, one aimed at people connected to my page, the other at people who weren’t.
I had installed a conversion pixel so I would know if the ads drove sales (more on this later). I noticed early on that the non-connected ads were getting more clickthroughs than the connected ad. I was interested to see if this was valuable traffic even if it didn’t convert so I created a tracking link so I could identify them in Google Analytics.
(Here’s a guide I wrote on creating tracking links.)
Now that the tracking link was in place, I could find out more about the site visitors coming from this ad set. You can do the same.
- From your Google Analytics dashboard select ‘Behaviour/Site Content/All Content.’
- Click on the name of the landing page for the ad.
- Choose ‘Source/Medium’ as a secondary dimension. There you’ll easily see the traffic driven by those ads.
![]()
See what happened (above) in my case? Although the bounce rate was high, this was to be expected. We created a dedicated distraction free landing page for the ads — so if you didn’t buy there wasn’t anywhere much else to go. Interestingly the bounce rate was lower than from people who visited from Facebook organically.
Google URL Builder is also useful for measuring traffic to your site from Instagram which at the moment appears as ‘Direct’ in your Google Analytics.
Bitly.com
Bitly is one of my favorite measurement tools. I don’t always have time to rifle through my Google Analytics, so Bitly makes it quick and easy to see how many people are clicking my links.
From the Bitly website you can shorten a link, share it on your social media channels and then measure the results.
Bit.ly breaks down your link clicks by source. In the example below, you can see that Facebook was the best social referral site for this particular link, distantly followed by Twitter.
One neat trick with Bitly is to combine it with your Google tracking links. If you create more than one tracking link to the same web page, you can create a unique Bitly for each one.
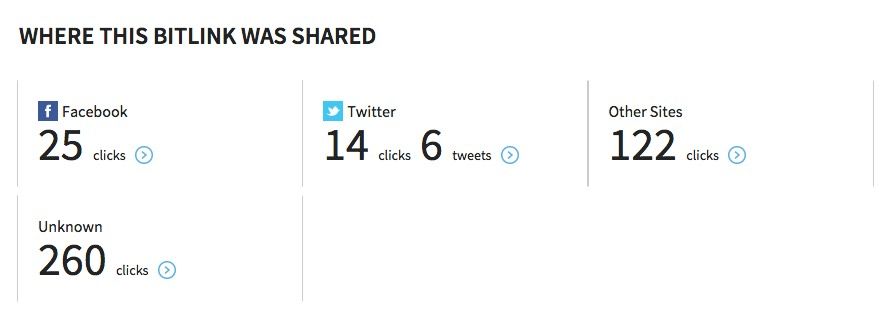
bitly shows you what channels people are clicking your links from.
Measuring Leads
What is a lead?
For the purpose of this post, I’m going to define a lead as someone who makes an inquiry through your website or social site or signs up to you opt-in email list.
Email subscribers
Using Google Analytics you can measure the number of people that subscribe to your opt-in list on your website.
To do this, you will need a dedicated thank you page that you send people to once they have subscribed. Measuring traffic to this page is the key to discovering how many subscribers came from social channels.
Find your Thank You page under ‘Behavior/Site Content/All Pages’ on Google Analytics as before. This time, choose ‘Referral Path’ as your second dimension. This will show you where the traffic that arrived at this page originated.
Now you will be able to see how many subscribers came from social channels and how many from other sites.
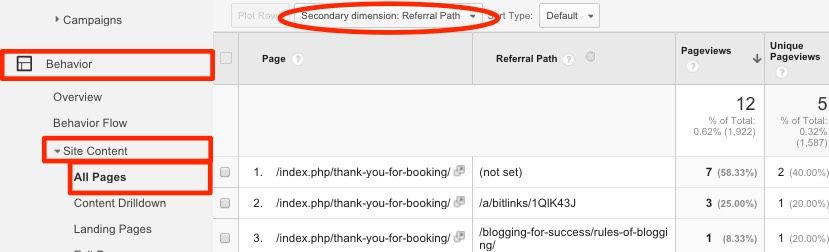
Track conversions with the ‘referal path’ secondary dimension.
As long as visitors are sent to a unique Thank You page on completion of a form, you can repeat this process for any contact or enquiry forms on your website. You can even measure the source of traffic to checkout pages on your site.
The Facebook Conversion Pixel
Install the Facebook Pixel on your site and you can ask Facebook to track conversions that occur as a result of your ad. A conversion could be a checkout, a download or an email subscribe. As with the Google Analytics method above you will need to have a dedicated Thank You page. It is visits to this page that will trigger the pixel.
Here’s an in-depth article from Jon Loomer on how to set up custom conversions.
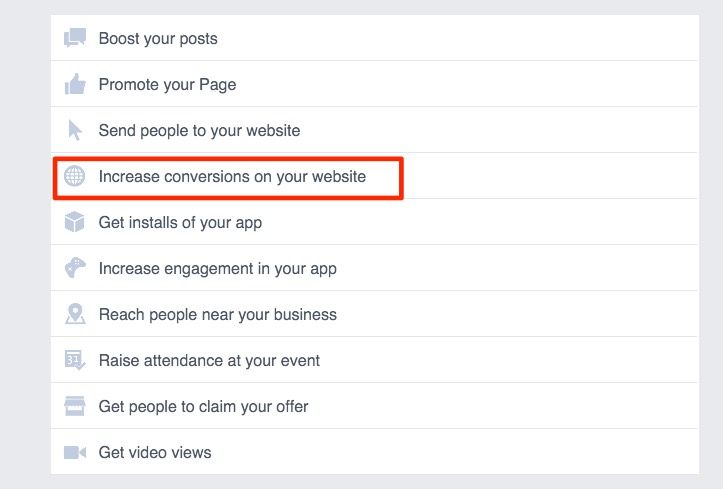
Create a Website conversion ad from your Facebook Ads Manager.
The most obvious way to do this is to set up a ‘Website Conversions’ objective when you create your ad — but you don’t have to stop there. You can add conversion tracking to any ad you create that points at your website.
In Ads Manager you will find this option in the creative section (see below). This will come in particularly useful if you have an eBook download or an email subscribe on your site.
Track conversions with Facebook pixel
Twitter conversions
Twitter ads also offer a conversion pixel. To set them up click on ‘Tools’ at the top of the advertising dashboard and select ‘Conversion tracking’ from the drop down menu.
Set up Twitter conversion tracking
As with Facebook ads you can set up ad campaigns with the specific objective of converting users. You can also measure conversions that happened as a result of any ad you run.
The report below shows conversions that resulted from an engagement campaign we ran. Our conversion pixel measures traffic to our website. What’s interesting about this is that the ads we ran didn’t contain any links to our website. It’s encouraging to know that people are still converting even if that’s not our key objective.
See conversions on any Twitter ad you run.
What’s next?
Now that you have learned the techniques to measure your social media success, you need to create a measurement plan. Here are some must-haves to include:
- Decide what metrics you are going to measure.
- Create a spreadsheet document to measure growth over time.
- Review your metrics, add or stop measuring others depending on your goals.
You will find that having a social media ROI measurement plan in place will help inform your content and make achieving goals easier.
Do you have any tips for measuring the impact of your social media marketing? Leave your thoughts in the comments below!


