

Are you aware that Twitter has made analytics available to everyone and not just advertisers? To see your account’s metrics, simply log in to https://analytics.twitter.com/.
At first glance, these statistics look pretty basic. The average Twitter user like me won’t get a whole lot of in-depth data. But, there are some special features to help you get more out of your marketing efforts and I’ll share them with you here.
Part 1: Tweet activity dashboard
This is the first thing you’ll see once you log in to the Twitter analytics site. This dashboard summarises your tweet activity for the past 28 days.
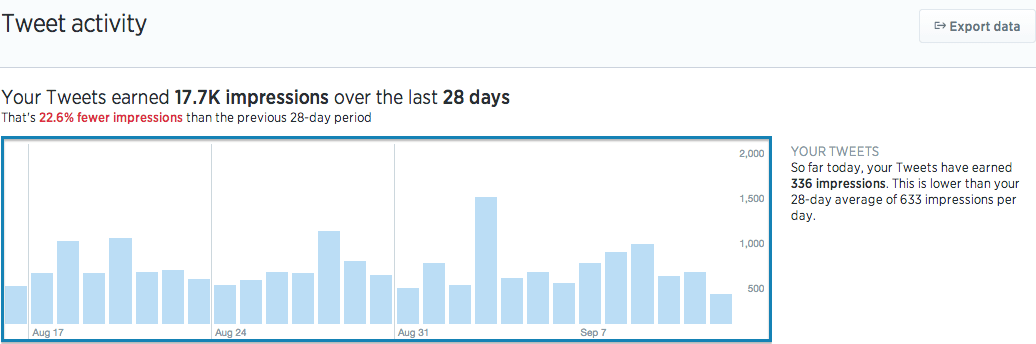
Here we see the number of impressions made by your account on a day-to-day basis. This is the main difference between Twitter and Facebook- all Facebook metrics begin with reach, a metric Twitter doesn’t provide. Twitter focuses on impressions as the measure of exposure.
Data is presented here in a more verbal but comparative way than Facebook. Instead of seeing numerous graphs on your dashboard, you’ll get numerous statements summarising your tweets’ performance. These statements compare your performance over the last 28 days with other 28-day periods.
Scroll down further to reveal 2 columns. The left column details the number of impressions and engagement for each tweet.
This is very similar to Facebook’s analytics for posts.
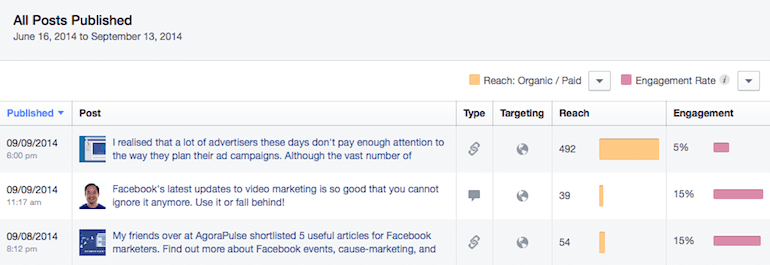
The right column focuses on engagement. According to Twitter, engagement is the “total number of times a user has interacted with a Tweet. This includes all clicks anywhere on the Tweet (including hashtags, links, avatar, username, and Tweet expansion), retweets, replies, follows, and favorites.”
In other words, engagement is the new reach, again. SinceTwitter engagement is so general, the total figure is not of much importance. It’s better off as a measure of awareness than real engagement.
If you want to peek into actual engagement, you’ll want to look at the engagement breakdown in the right column.
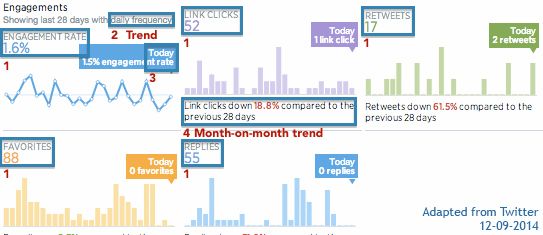
The engagement breakdown has five sections, namely:
-
- o
- Engagement rate
o
-
- Link clicks
o
-
- Retweets
o
-
- Favorites
o
- Replies
Each of these sections show:
-
- o
- The average daily count over the last 28 days, shown above
o
-
- The daily count over the last 28 days in a graph, shown above
o
-
- The present day count, e.g. 1.5% (above)
o
- How the average daily count over the last 28 days compares with the previous 28 days
If you’re using Twitter to generate traffic to your website, you’ll want to pay attention to link clicks. If you want to find out how influential your brand is, you’ll want to look at the number of retweets, favorites, and replies. Just take note that the quality of replies is usually more important than the quantity.
This basically sums up the Tweet activity dashboard.
Part 2: Followers dashboard
When you click on the “followers” tab at the top of the page, you’ll be able to dig into some interesting demographic data.
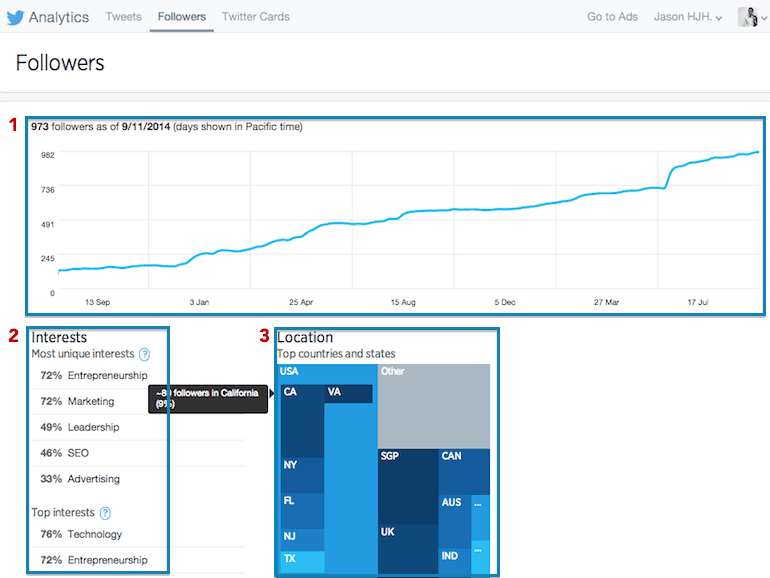
1. Followers Growth
The first graph shows the growth of your followers over the past year. This is no different from Facebook’s ‘page like growth’ graph.
2. Interests
Perhaps the most valuable set of data offered by Twitter analytics for non-advertisers.
Twitter is able to categorize each user’s handle and show you your followers top interests through its algorithm. If those interests match your target, it’s a good sign that you have a relevant audience.
3. Location
The location section is also similar to Facebook’s. It shows the top countries. states, and cities your followers are from. Self-explanatory.
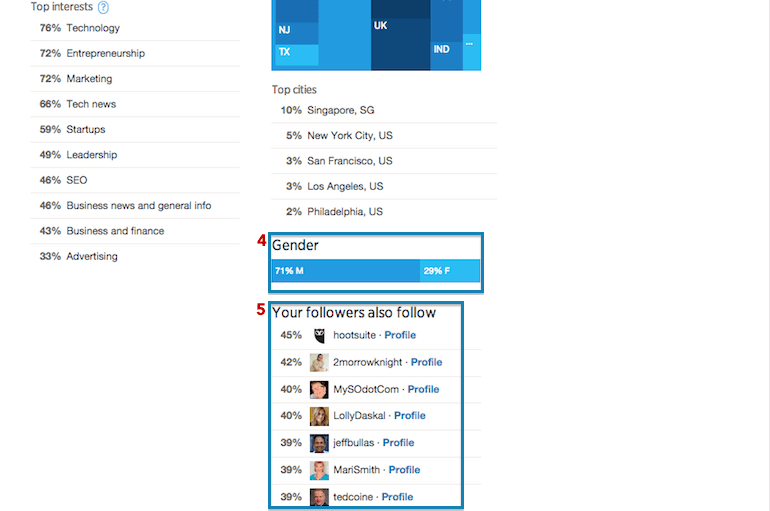
4. Gender
The gender section is simple and less detailed like Facebook’s. This is because Twitter has not added all the different genders to its platform. In case you missed Facebook’s announcement earlier in February, these were the genders Facebook added.
5. Your followers also follow
This is another interesting section found in Twitter analytics.
It shows you the top accounts followed by your followers. This bears a bit of resemblance to Facebook’s graph search function, where you search for “Favorite pages of [insert your page name] fans”.
Using this data, you can easily find influencers you should connect with. Influencer marketing, either organically or sponsored, has become a core part of most successful businesses’ social marketing strategy.
Have you tried it?
Do you use Twitter for your business? Let us know if you think that the analytics are useful!


