

If you’ve been running ads on multiple platforms like Facebook and Google, you’ve probably had difficulties determining how to attribute your conversions. For example, did your most recent sale come solely through a Facebook ad, or was it a combination of Facebook, Adwords, and organic search?
Not knowing which sources are responsible for specific actions (like conversions) makes it difficult to allocate and scale your advertising. Should you invest more in Adwords or Facebook ads? It depends on which is converting more effectively.
Fortunately, the Facebook attribution tool helps set this straight. It eliminates the guesswork, so you can get more out of your advertising.
What Exactly Is Facebook Attribution?
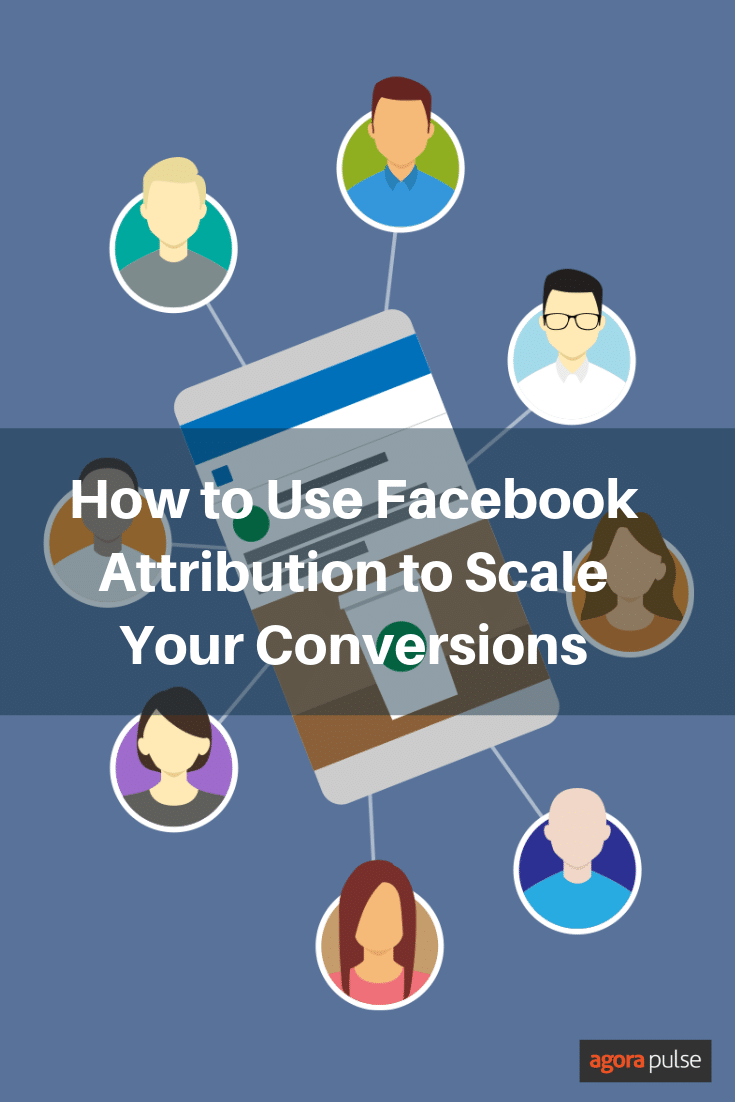
The Facebook attribution tool helps you better understand how users interact with your ads to determine the “customer’s journey” leading up to actual conversion.
You then can pinpoint when a user clicked on an ad, followed a link, watched a video, performed various tasks in your e-commerce store, and so on.
You can even dial down into whether paid or organic sources work better, if users are converting strictly through mobile devices, or if they use multiple platforms to interact with your content.
That data helps you determine your best marketing course of action and to scale your advertising accordingly.
Facebook Pixel and Conversion Tracking
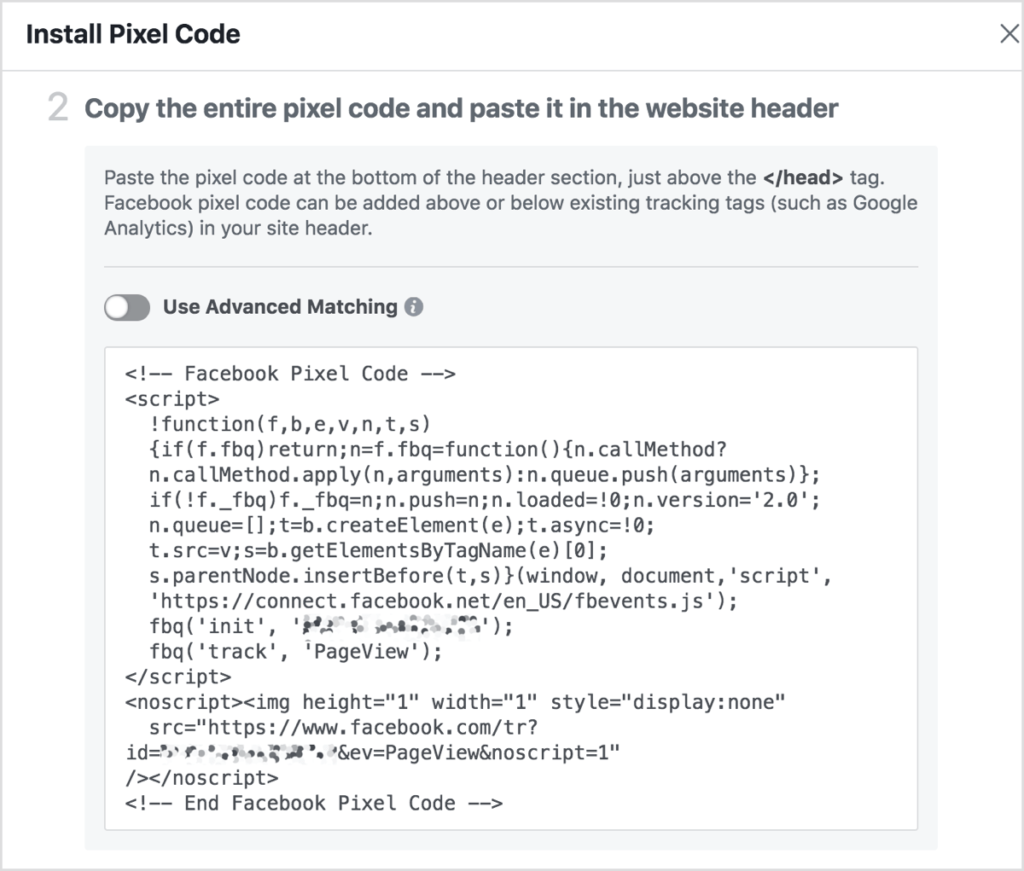
For Facebook attribution to work, you must first install the Facebook pixel code on your website. You also need to create a custom conversion or event, so Facebook knows when a conversion occurs.
We assume you’ve already added the pixel to your site. If not, here are instructions for the installation and set-up.
Should you encounter any issues, this is an excellent resource for ensuring the pixel tool is running smoothly.
Once completed, you are ready to set up Facebook attribution.
Step 1. Ensure You Set Up Your Line of Business Correctly
Within the Settings tab of the Attribution section, a status bar reflects where your set-up stands. The three stages are Line of Business Created (which you’ve already completed); Clicks, Impressions, and Visits; and Waiting for Conversions.
You should see an active status under Waiting for Clicks, Impressions, and Visits. Your data will take approximately an hour to populate.
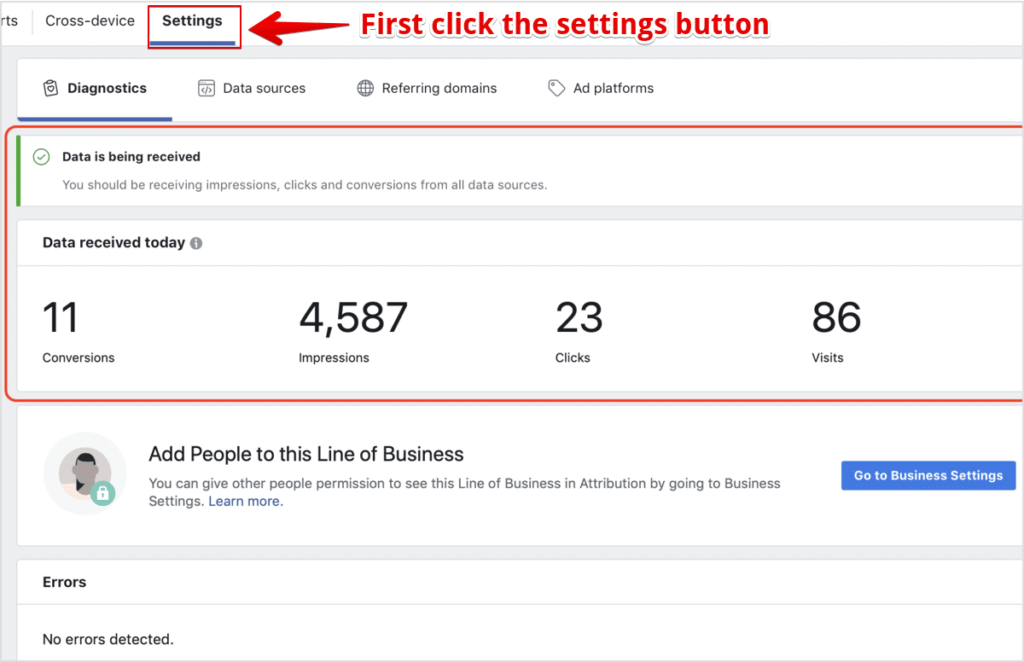
Once the populating is complete, you want to ensure that you receive data.
From your main Attribution dashboard, head to the Settings tab. You should then see a confirmation that “Data Is Being Received.”
Underneath that will be a display of that day’s numbers, including Conversions, Impressions, Clicks, and Visits.
Step 2. View Your Data
With the initial set-up now complete, you can review the captured data according to the type of conversion.
From the top right corner, click the Conversion drop-down.
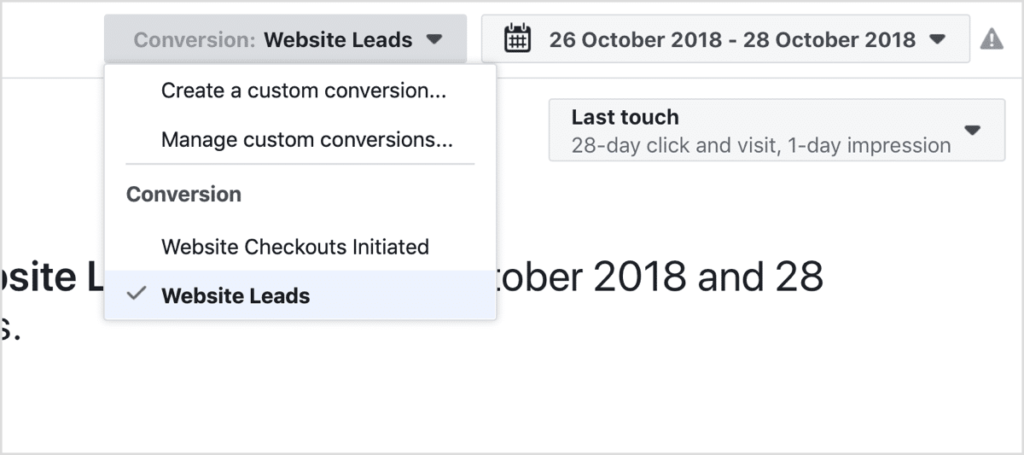
You’ll see a list of conversion events you previously added to your website or e-commerce store, such as lead tracking, add to cart, or checkout.
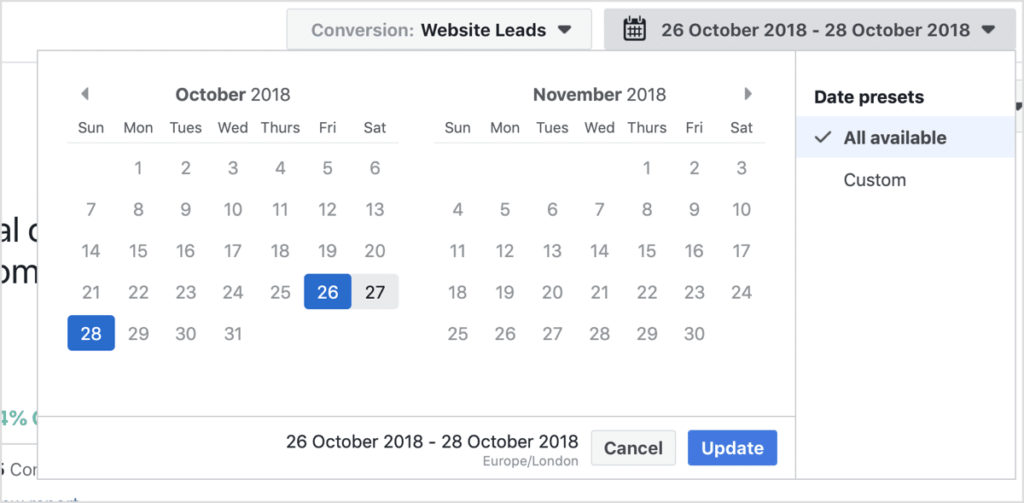
After choosing the type of conversion, select the date range. Your calendar begins on the day of set-up, so you have to let time pass before you start building historical data.
Now, it’s time to set your attribution model and window.
There’s plenty of choices here, which means you can dial in the combination that best suits your business.
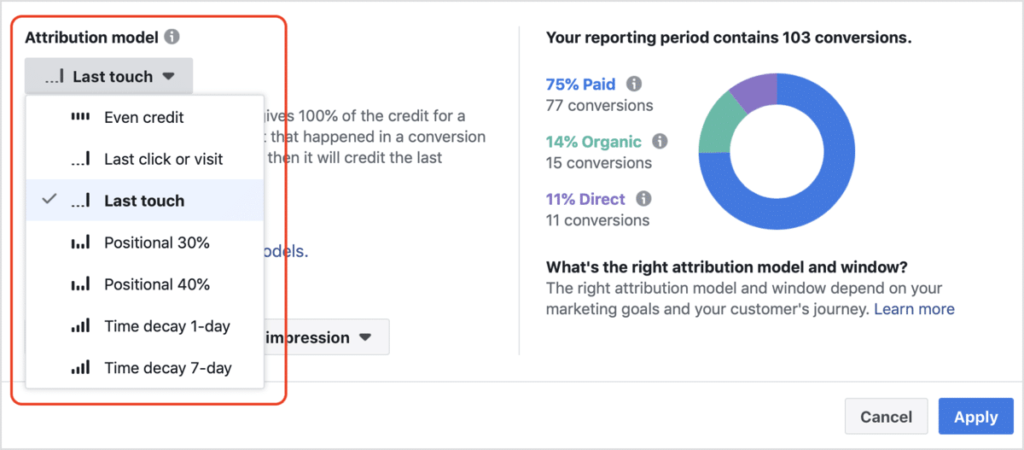
The seven attribution models include:
- Even Credit
- Last Click or Visit
- Last Touch
- Positional 30%
- Positional 40%
- Time Decay 1-Day
- Time Decay 7-Day
For the attribution window, you can select from 17 options, providing a multitude of looks.
The great thing about the model and window setup is it serves multiple business needs. You can measure performance for small-scale campaigns or those with a single touchpoint to viewing results from broader initiatives that occur over months instead of days or weeks.
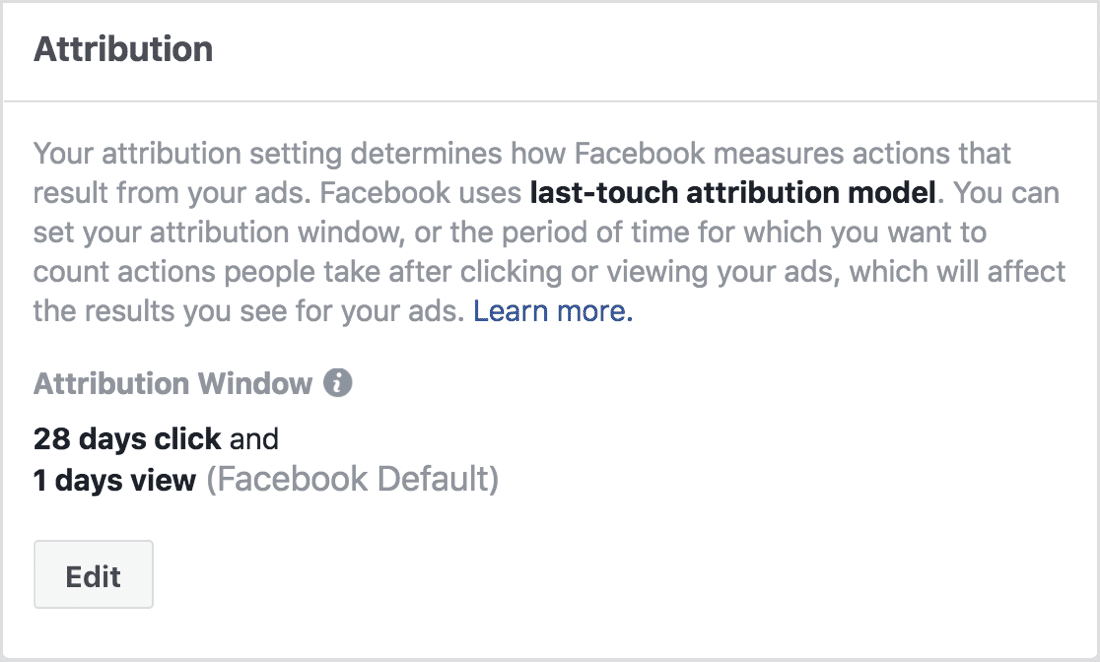
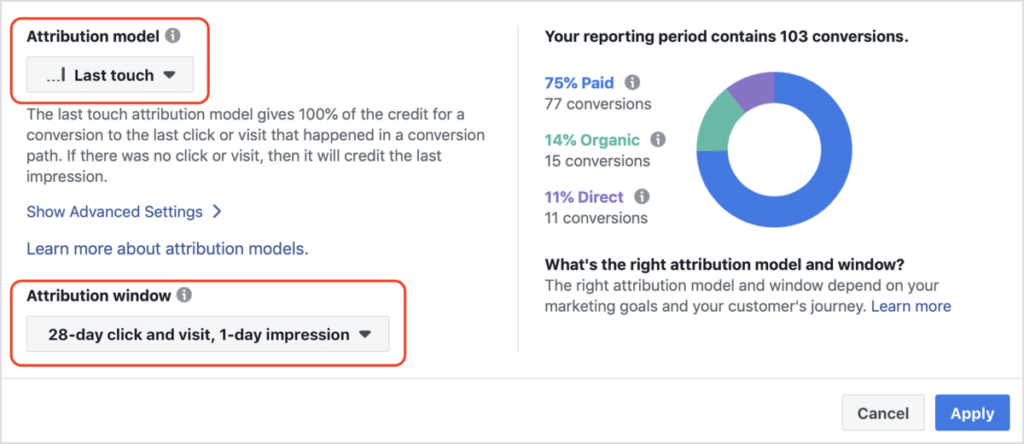
For this post, we’ll use the Last Touch model, which attributes 100% of the credit for a conversion to the last click or visit.
Out of all the attribution models, the Last Touch is the simplest to understand. Because 100% of the credit for the conversion goes to the last click, this attribution model lets you see which sources most effectively create the final conversion event.
The other attribution models give you a fuller picture of the customer buying journey. They are helpful if you want to have a holistic understanding of your customers. For example, the even credit attribution model assigns even conversion credit to different touchpoints, such as clicking on ad, viewing an ad, visiting a page, etc.
Using this model allows you to see each step the customer took before buying and to make an educated guess about which steps were most important.
As Facebook notes, “Compared to the last touch or last click model, even credit better reflects how all touchpoints helped lead to a conversion and can help you build intuition on how multi-touch attribution can inform your business decisions.”
As we noted prior, you will need to allow some time before the attribution window reflects any historical numbers, so chose the default window setting of 28-day click and visit, 1-day impression.
To populate your dashboard, click Apply.
Step 3. Analyze Your Data
Now, let’s jump into analyzing the populated information.
From your main dashboard, you can see the detail of your numbers by channel including Conversions, Visits, and Sources.
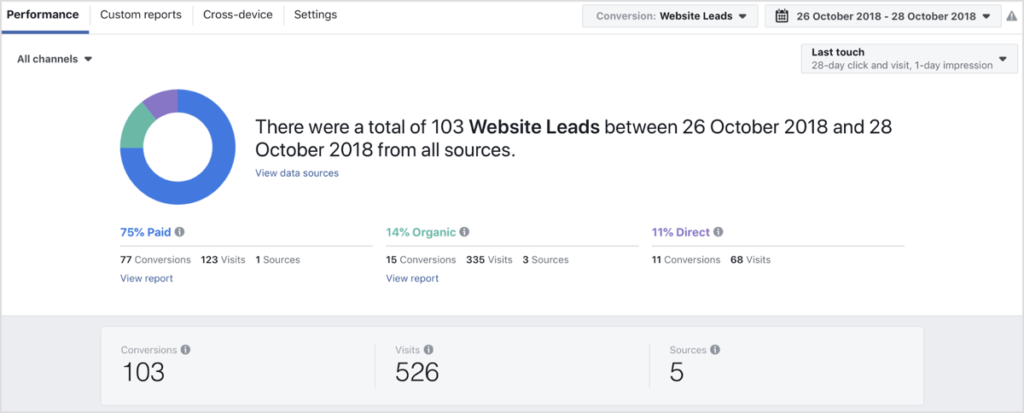
You can drill down into the data sections to see the individual performance, such as paid sources versus organic or which campaigns garnered the most conversions.
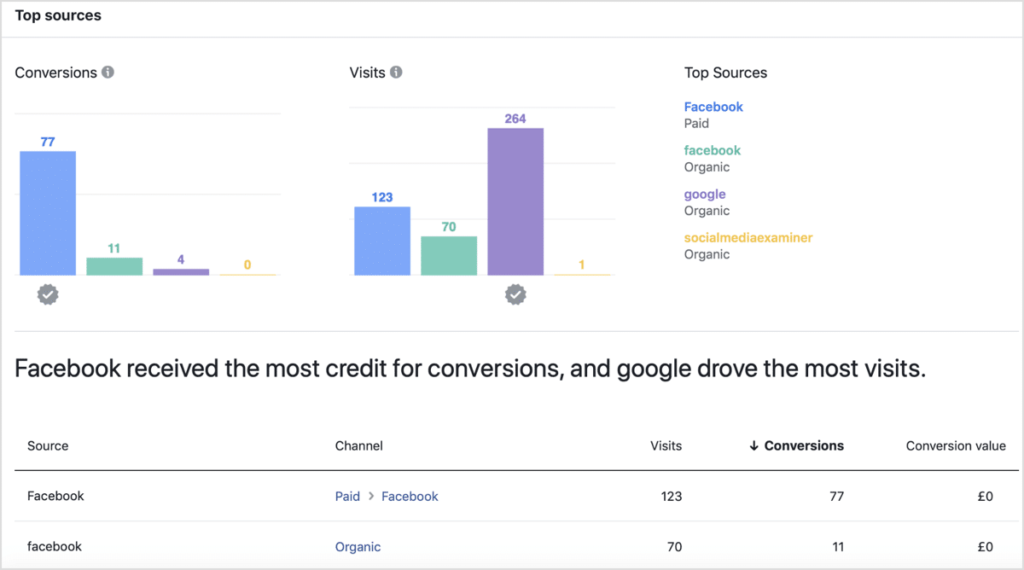
Further down the page, you can find Top Sources, which shows you where your conversions and visits originated. This is especially helpful data for deciding how to scale your efforts. You can determine which sources are driving both conversions and traffic.
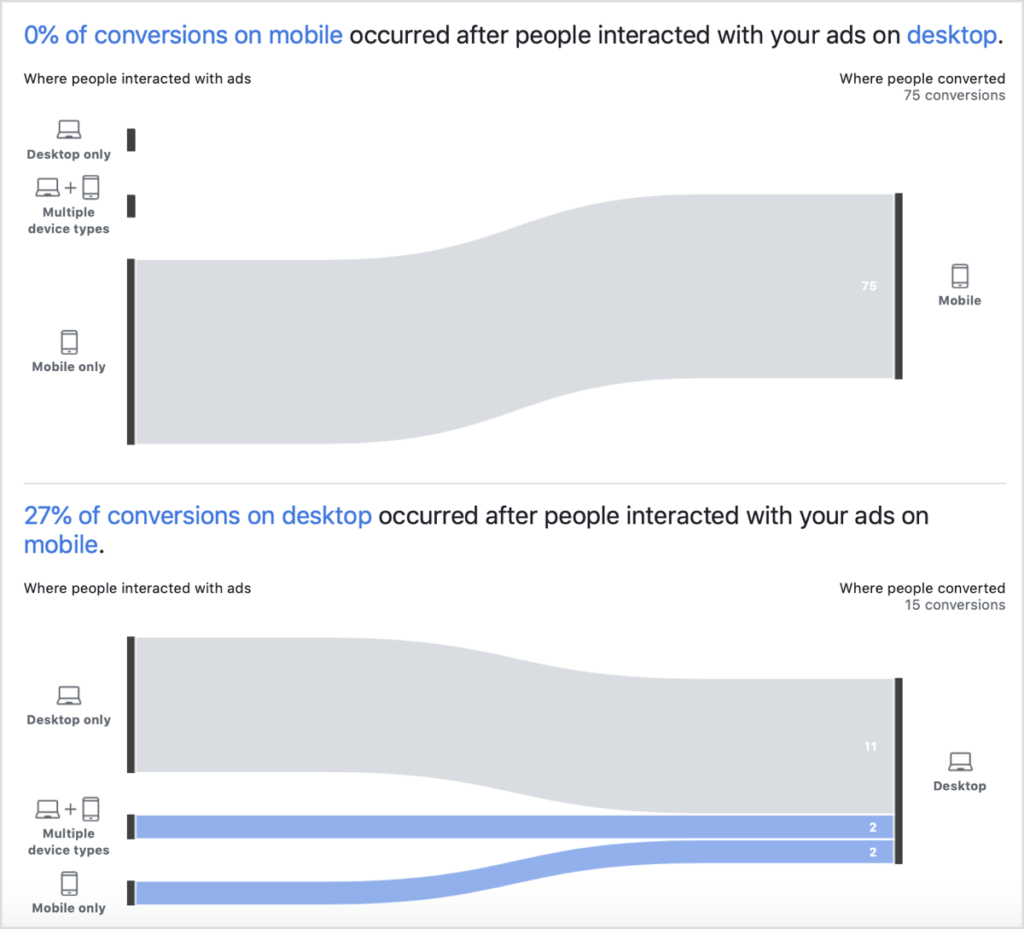
To review how your conversion data did on different devices, click the Cross-Device tab from the top of your dashboard.
From this section, you can determine if conversions occurred via a single device, such as a smartphone or across multiple devices. For instance, if a user began engagement on a desktop but converted when later using a tablet.
Beyond the basics, to thoroughly analyze how conversions are occurring, you will want to adjust the attribution models to fit your business needs.
For instance, if you’re running a B2B business, conversions can take weeks, or even months to occur. Compare this to a B2C business where a conversion can literally happen a few moments after a person clicks on an ad for the first time. Adjust your attribution window so that it reflects both your business and your industry
In either case, understanding the data you get back will take some adjustment.
Facebook reports are based mainly on initial views or clicks—not necessarily when an actual conversion (i.e., purchase) occurs.
For example, a user clicks one of your ads on January 1 but doesn’t make a purchase until January 15. According to Facebook, the conversion still transpired on the 1st.
A second scenario may look like this: On January 1, a user clicks an ad. On January 15, the user clicks the ad again. Then on January 20, the user only views the ad. Then on January 25, the user clicks the ad one final time. Five days later, the user views the ad and make a purchase.
Here, it’s less clear as there were multiple clicks and views. In this instance, the most recent click—the one on January 25—is the conversion.
Step 4. Scale Your Ads
In going through the set-up and initial stages of Facebook attribution, you now understand why the data is so important.
Knowing the behaviors and habits of your audience will ensure you develop marketing initiatives that generate more customers.
When analyzing reports to determine to scale up or down, or to eliminate some of your advertising efforts, you want to look for patterns.
For example, breaking down the attribution data can help identify the following scenarios concerning three separate ads:
- Ad 1: High engagement but few to no conversions
- Ad 2: Sporadic engagement and no conversions
- Ad 3: Sporadic engagement but high conversions
Looking at these three examples and some actionable items come to light:
- Ad 1: Let it run a bit longer in its current state. If the pattern continues, dedicate resources—through wider reach or adjustment to the ad—to help push its high engagement factor into conversions. One of the best ways to monitor engagement (comments, etc.) on an ad is to use Agorapulse.
- Ad 2: Cease the ad and reconsider either the target audience or ad itself, shifting resources to more viable prospects.
- Ad 3: Apply more resources to put this ad in front of a wider audience. No changes are necessary to the ad itself until after the broader target group has time to interact with it.
As you can see, knowing what is happening within your advertising means refining your approach and better allocating your resources.
* * *
Facebook’s attribution tool is incredibly powerful and allows you an in-depth look at how and when users find and interact with your ad campaigns.
It will also ensure you are more dialed into which campaigns work, which ones don’t, and how to allocate your resources accordingly.
Remember, you need to do more than just set up the tool and give it a glance from time to time. For it to be effective, make reviewing the data part of your regular business routine.
When you understand just exactly what your customers are doing, you’ll quickly figure out what you need to do to acquire more.
Pin This Post


