

Analyzing Facebook statistics can be daunting, even for experienced social media managers. With so many types of Facebook reach metrics and so many options for accessing them, how do you know where to focus?
Let’s take a closer look at Facebook reach and how to use it in your social media.
Facebook Reach vs. Impressions: What’s the Difference?
No matter where you access Facebook analytics for your company or clients, you’re likely to find both reach and impressions in every report.
Both metrics are important for understanding your results, as they highlight different aspects of your page’s performance.
Facebook reach
Facebook reach reflects the number of people who saw your page or your content in their news feeds. Because this metric is tied to individual users, it’s a good measure of how many customers (existing or potential) you’re connecting with.
Whether you’re curious about paid or organic reach, Facebook offers a lot of different reach breakdowns.
We’ll cover how to find and analyze these types of reach statistics below:
- Organic reach, which indicates how many people saw your page’s content—either because they saw it in their news feeds or because they visited your Facebook page
- Viral reach, which indicates how many people saw your page’s content in their news feeds because their friends liked, commented on, or shared your content
- Paid reach, which indicates how many people saw your sponsored content promoted in their news feeds
You can access several types of Facebook reach using Agorapulse and native Facebook tools, including …
- Page reach: The number of people who saw your page
- Post reach: The number of people who saw an organic post
- Ad reach: The number of people who saw a promoted post
Facebook impressions
Facebook impressions reflect the number of times your Facebook page or content appeared in users’ news feeds.
Because some users may see your page or content multiple times during a given time frame, impressions can be a good measure of your brand’s prominence and popularity.
Agorapulse social media reports make it easy to evaluate your page’s impressions quickly.
Go to the Audience tab in the Reports section of your dashboard, and scroll down until you see the Impressions chart.
You can use the chart to identify patterns over time or check the tally to see the total activity for the entire time period.
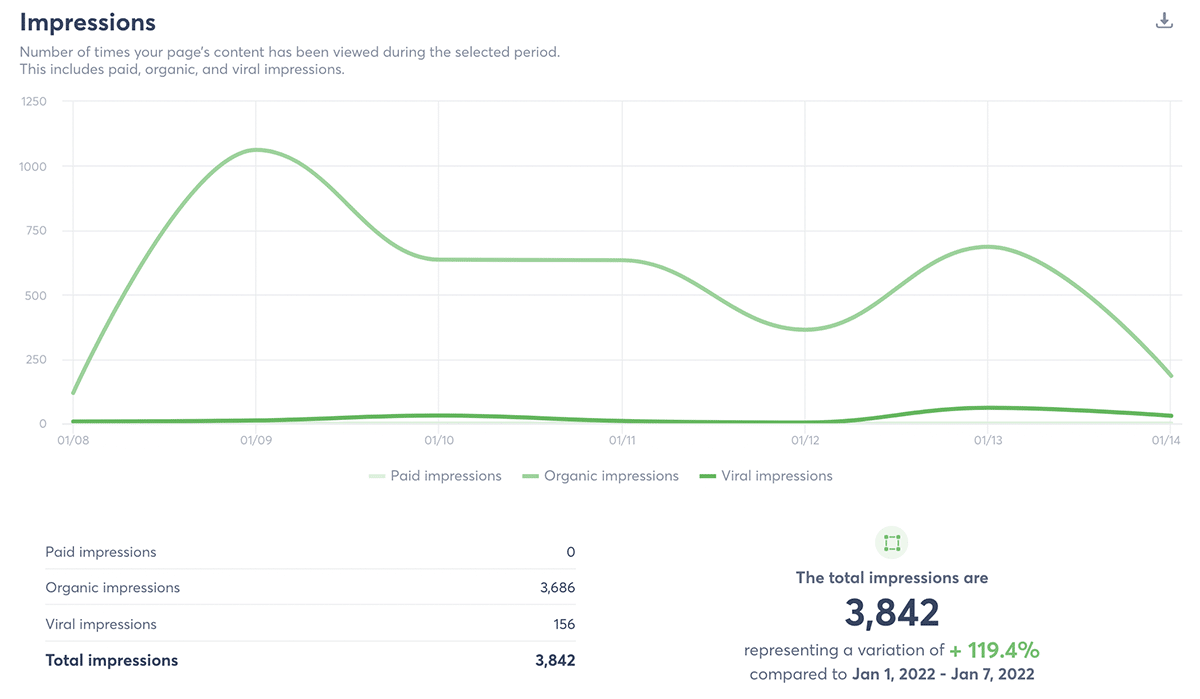
While Facebook only includes impressions in downloadable spreadsheets or ad reports, Agorapulse automatically visualizes three types of impressions:
- Organic impressions, which result from your followers seeing the content you publish to your page
- Viral impressions, which result from Facebook users seeing your content because a friend liked, shared, or commented on your post
- Paid impressions, which result from Facebook users seeing the sponsored content you paid to promote
Why you should monitor Facebook reach statistics
Although impressions and reach both offer helpful insights, most businesses prioritize the latter. Facebook reach is important because it:
- Calculates people rather than views. If you want to make sure you’re continuously expanding your customer base, connecting with more of your audience, and improving awareness, reach can help you monitor your progress.
- Reveals whether you’re engaging your audience. The Facebook algorithm prioritizes high-quality content from pages that users engage with frequently. High reach can be an indicator of good quality and great engagement.
- Helps you evaluate your page’s potential. Once you know how many people see your content, you have a better idea of the possible results. What percentage of people are interacting with or clicking on your posts? Can you improve results from week to week or month to month?
How to Track Organic Reach for a Facebook Page
Agorapulse, Creator Studio, Facebook Business Suite, and Facebook Page Insights all provide reach metrics for pages.
Take a look at the options to find the one(s) that best meet your team’s needs.
Monitor organic Facebook reach statistics with Agorapulse
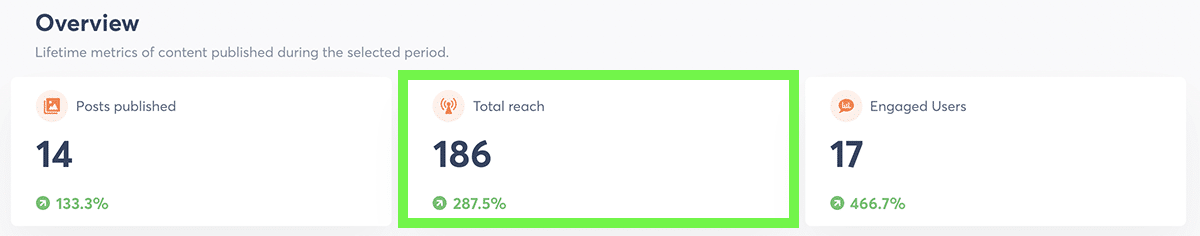
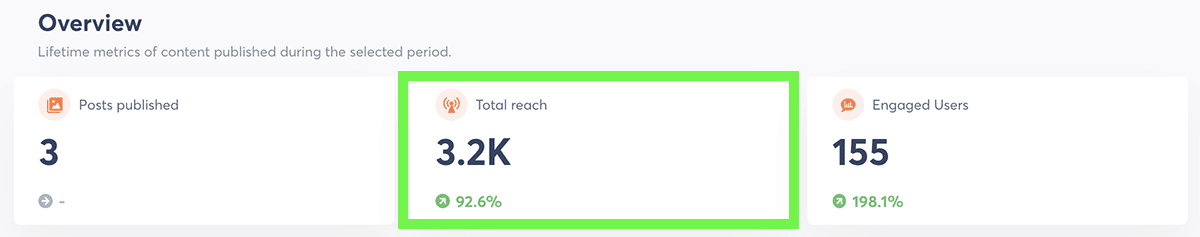
To see your page’s total reach for any time period, open the Reports tab and select Content (Global).
Agorapulse automatically calculates the total number of users who have seen your content. Below the tally, you can also see how your reach compares to the previous time period.
This comparison can help you make sure you’re on the right track.
Agorapulse can also use reach to identify top content for any time period. Scroll down to the Top Content selection and select Reach from the dropdown menu.
In seconds, you can pinpoint the six posts that reached the most people.
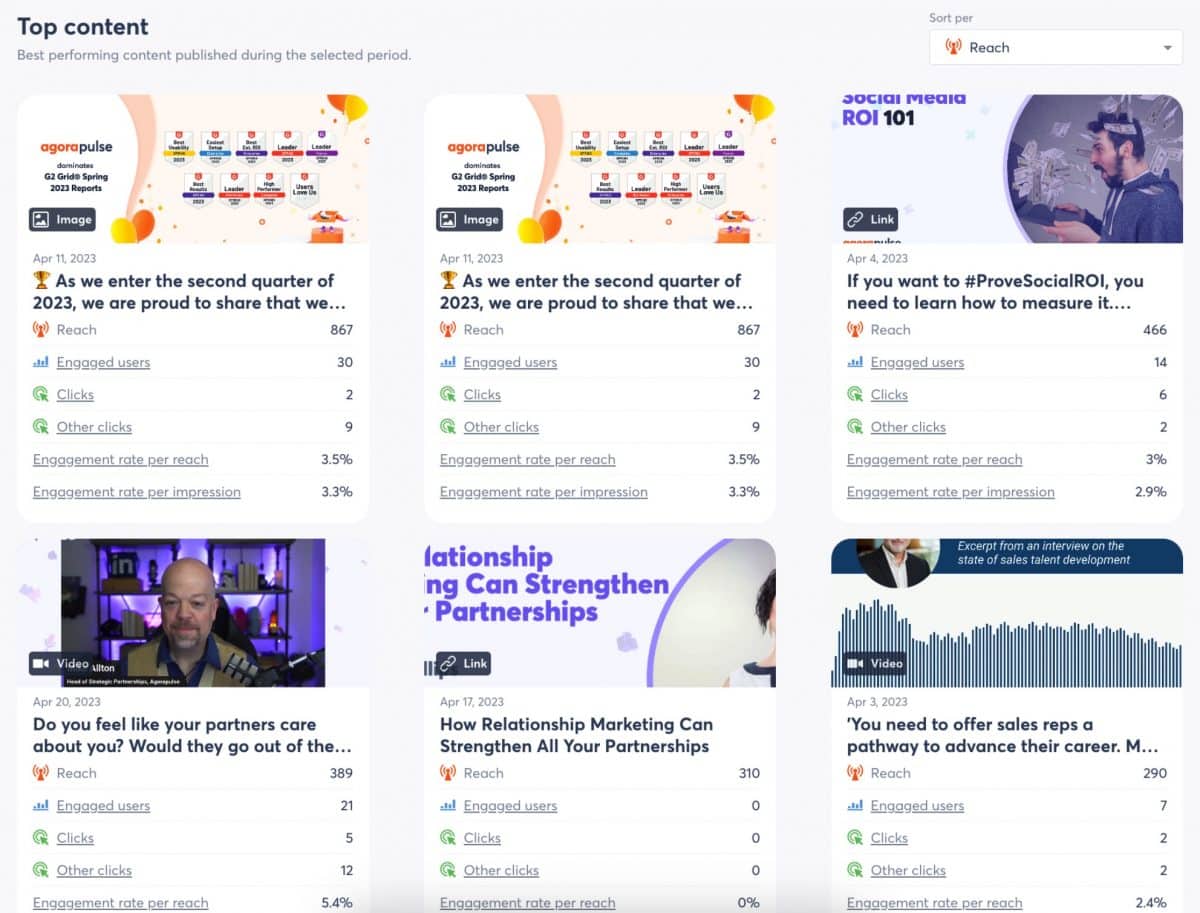
In Agorapulse you can view data about your top performing content on Facebook, including metrics like reach, engaged views, clicks, and engagement view per reach.
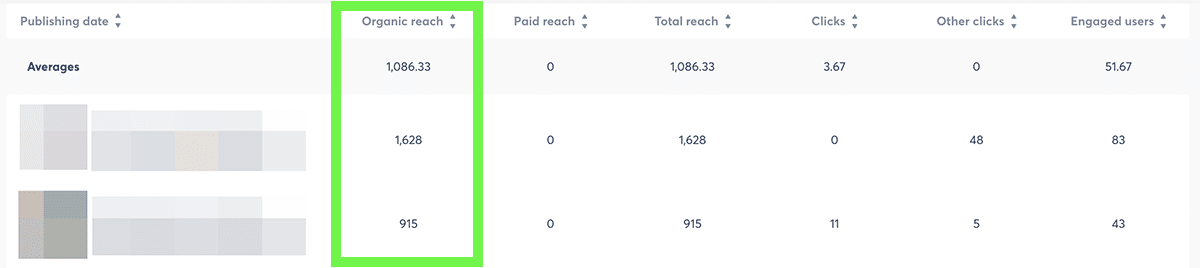
For a bigger-picture view of your page’s reach, select Content (Performance).
You can sort by organic reach or total reach, making it easy to see which posts people saw most or least. This chart also shows Facebook engagement metrics, so you can see how reach and interactions compare.
Are you curious what kinds of content reached the most people or when it was most likely to appear in your followers’ news feeds?
Agorapulse’s Content (Global) report has the answers.
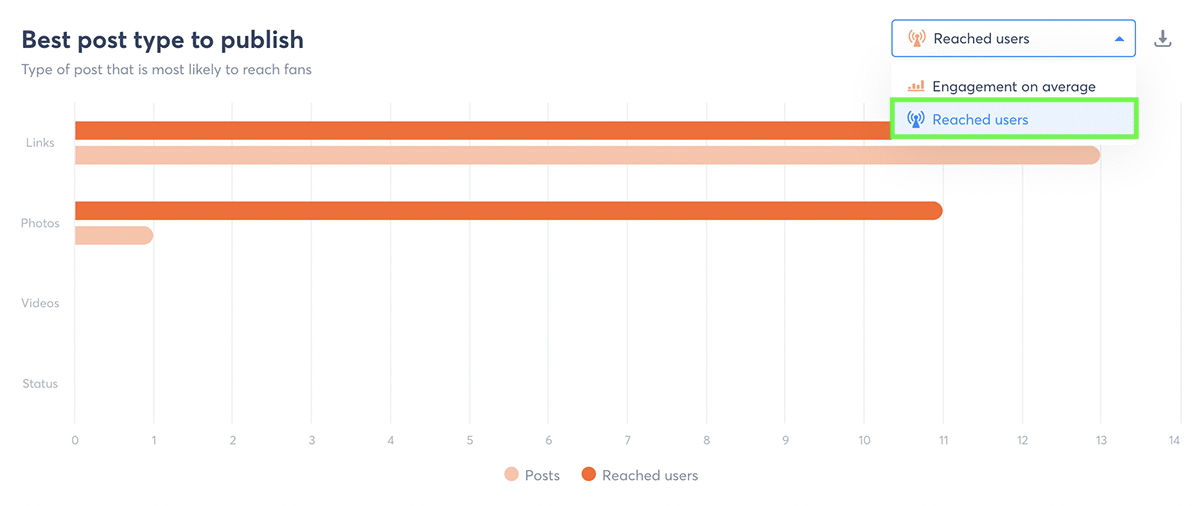
Scroll down to the Best Post Type to Publish graph and select Reached Users from the dropdown menu. You can instantly see whether links, photos, videos, or status updates reached the most people—which can help you decide what kind of content to post next.
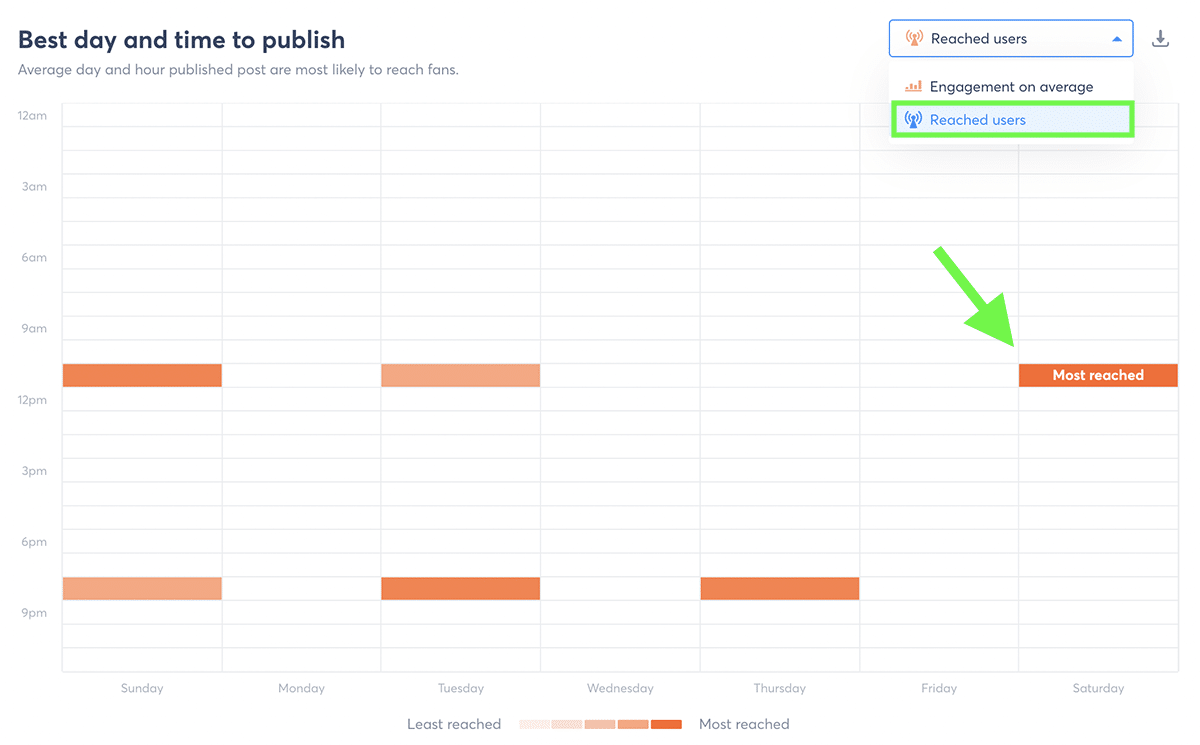
Next, find the Best Day and Time to Publish chart and select Reached Users from the dropdown menu. You can quickly see when your content has appeared most often in news feeds—which can help you schedule your content at the most optimal times for reach.
Track organic reach with Creator Studio
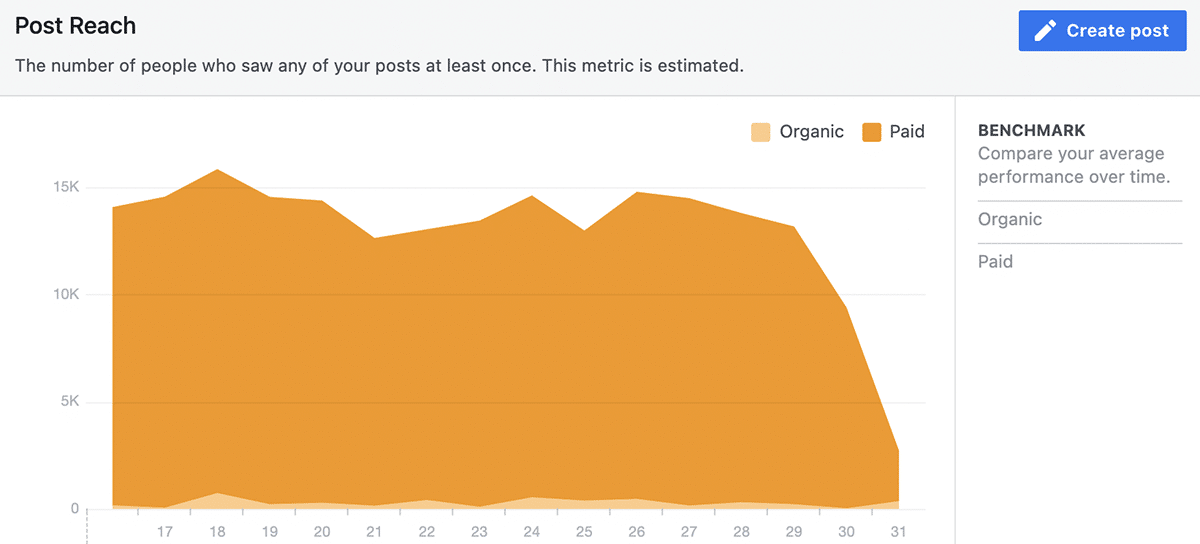
To see your page’s total reach for any time period, go to the Insights tab in Creator Studio. You can see the total number of people your posts reached for any time period. It also breaks down your reach for organic and paid posts, so you can quickly differentiate between the two.
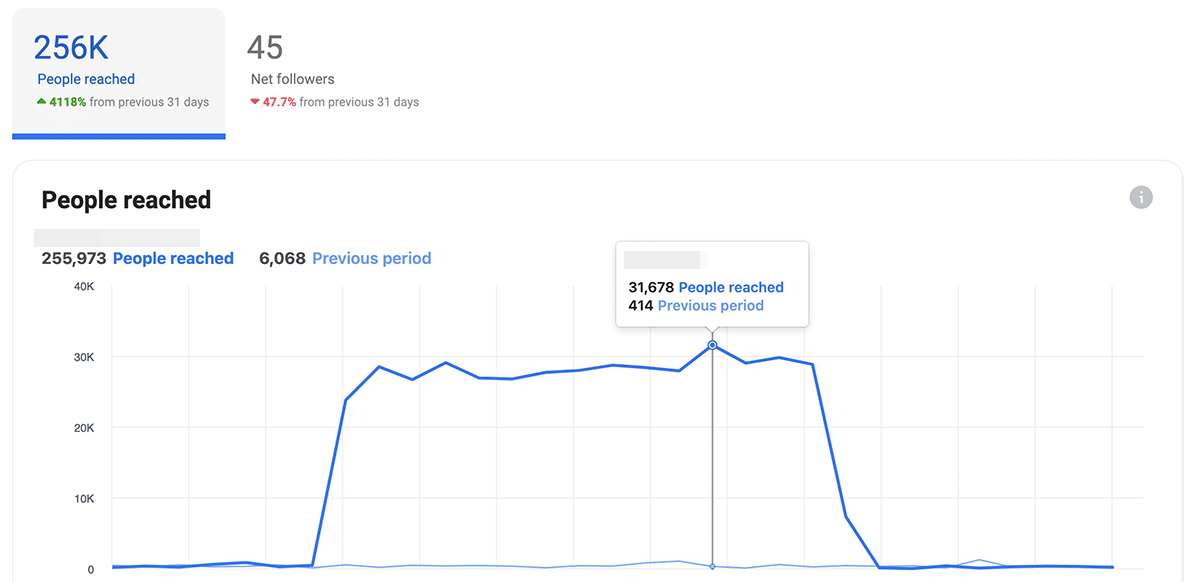
You can hover over any spot on the graph to see metrics for a specific date. You can also see a tally for the entire time period above the chart, along with a comparison to the previous time period.
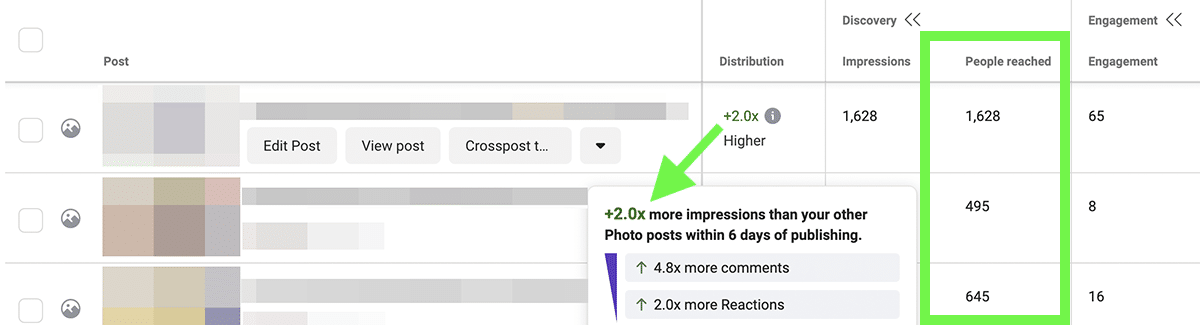
On the Published tab, Creator Studio breaks down reach by post. This tool also calculates the distribution score for each post and shows you how its engagement metrics compare to the average for your page.
Together, these Facebook statistics can help you understand how reach and engagement work together to get results.
To review different types of content individually, you can click on the Stories, Photos, Links, and other tabs to filter out other types of content. For example, you can get a more in-depth look at Facebook video metrics or live streaming analytics.
Access organic reach in Meta Business Suite
Business Suite also tabulates total reach for your page.
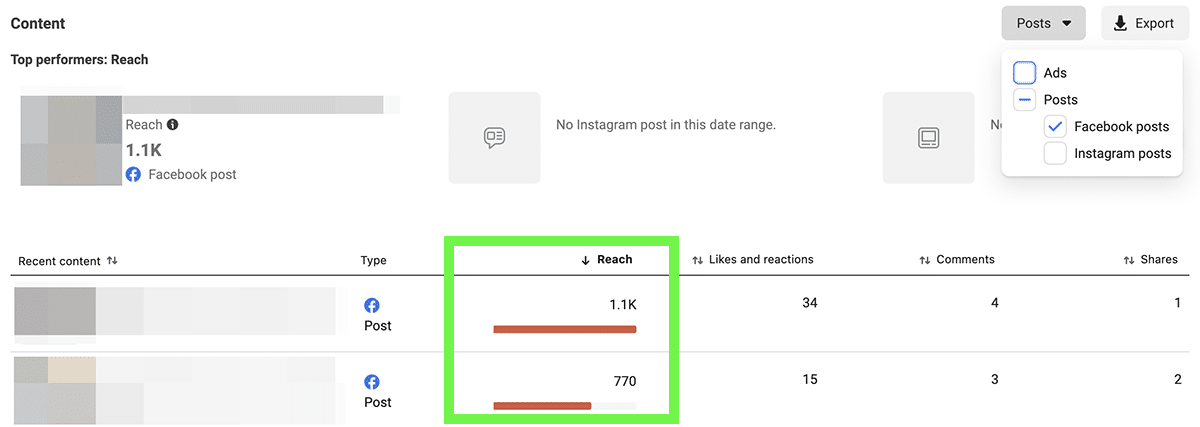
You can filter out paid content on the Content tab. Business Suite automatically displays the post with the highest reach at the top of the report so you can quickly identify top content.
In addition, you can sort by reach to find your most and least successful content for the time period.
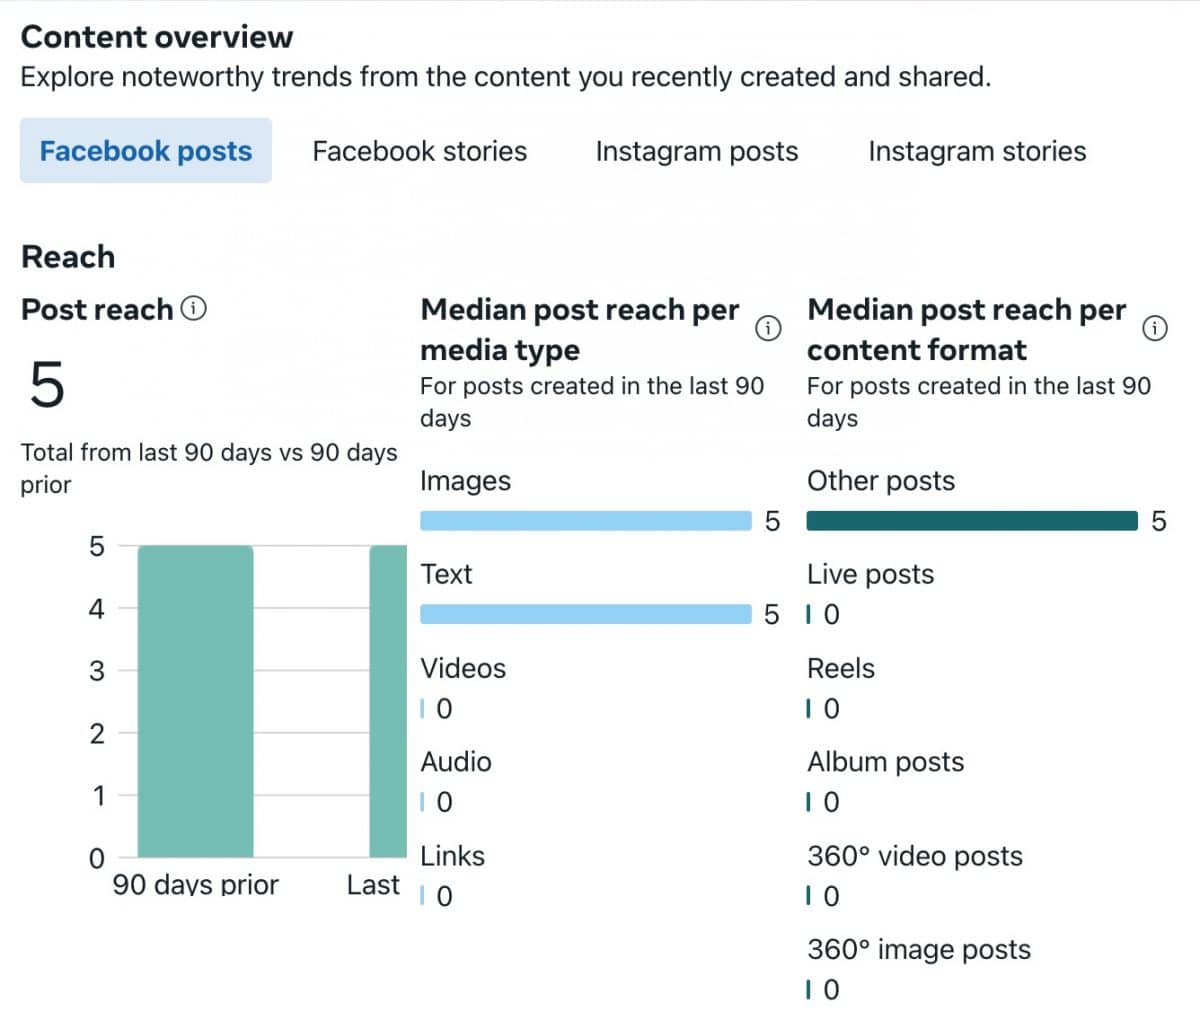
You can also see reach statistics in Meta Business Suite for your Facebook posts, Facebook stories, as well as your Instagram posts and Instagram stories. This will show you the median post reach per per content format, and the median post reach per media type.
Find organic reach in Facebook Page Insights
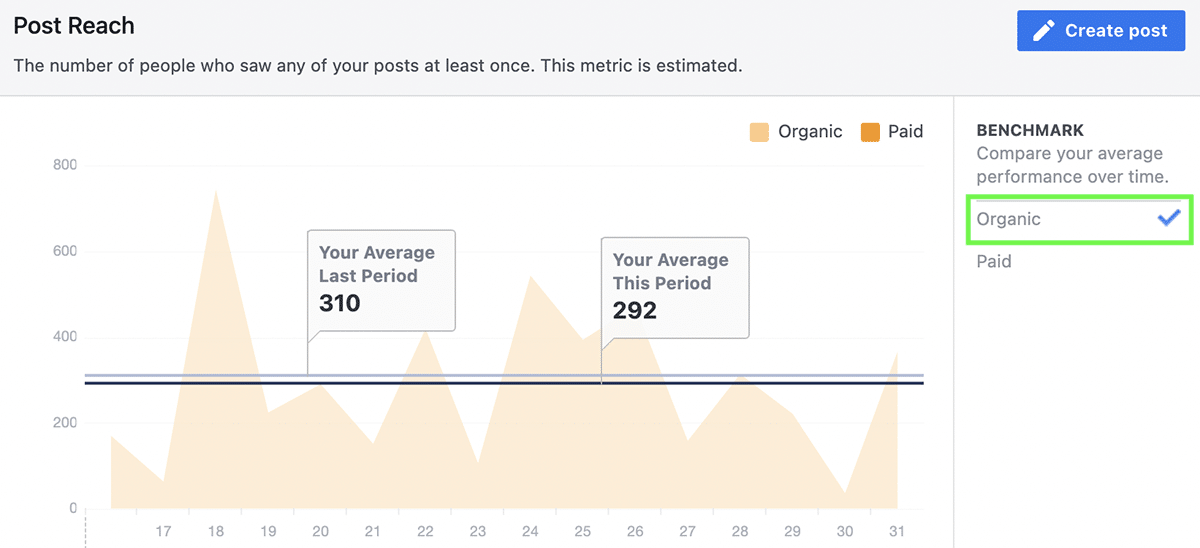
Facebook Page Insights also has some helpful charts and benchmarking tools. The Reach tab shows total reach for any time period, using two shades to differentiate organic from paid reach.
Click either the Paid or Organic box to the right of the chart to benchmark your page reach. You can see your average for the current period compared to your average for the prior period.
If you download page- and post-level metrics from the Overview tab in Page Insights, you can access much more detailed data, including …
- Daily, weekly, and 28-day organic reach: The number of unique people who have seen your page in their news feeds over the course of the day, prior week, or prior 28-day period
- Daily, weekly, and 28-day post reach: The number of people who saw your posts over each time period
- Lifetime post organic reach: The number of people who have seen each post
Note that these metrics are available in spreadsheet format only. That means you may need to transform them into a graph to help your team visualize the results and use them to create better content.

How to Find Viral Reach for a Facebook Page
Download viral reach from Page Insights
Although Page Insights doesn’t have a comparative tool, it does provide more detailed data on your viral reach. When you export Page-level metrics, you can see …
- Daily, weekly, and 28-day viral reach: The number of unique users who have seen your page in their news feeds over the course of the day, prior week, or prior 28-day period—due to their friends’ reactions, comments, and shares
- Daily, weekly, and 28-day post reach: The number of Facebook users who saw your posts over each time period due to their friends’ social actions
Page Insights doesn’t break down viral reach by post. But you may be able to use daily reach to help you identify posts that generated the most viral reach—especially if you post just once per day.
How to Access Paid Reach for a Facebook Page
Agorapulse, AdsReport, Facebook Business Suite, and Facebook Ads Manager all track paid reach.
Review the tools below to help your team analyze Facebook ad metrics more efficiently.
Monitor paid reach with Agorapulse
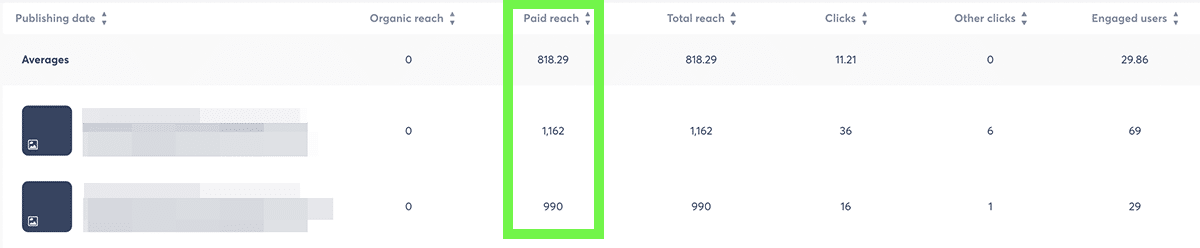
If you’ve promoted an organic post or published a dark post on Facebook, Agorapulse automatically tracks the results. To see paid reach for individual posts, go to the Content (Performance) tab in Reports.
You can sort by paid reach and see how this metric factors into total reach.
Check paid reach with AdsReport
If you’ve set up Facebook campaigns in Ads Manager (instead of boosting posts), you can track paid metrics in Agorapulse’s AdsReport.
With this tool, you can quickly find total reach for your entire ad account or for a single campaign.
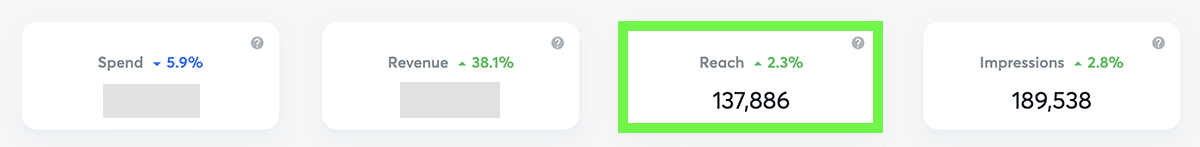
AdsReport also provides comparative metrics so you can see how reach for the current period compares to reach for the previous period.
If you find that Facebook reach statistics is declining over time, you can start strategizing ways to get ad performance back on track.
Access paid reach in Facebook Business Suite
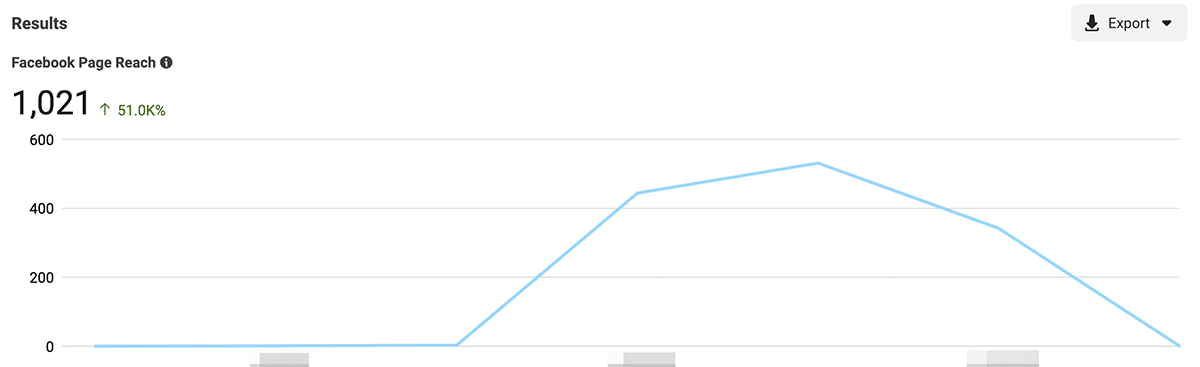
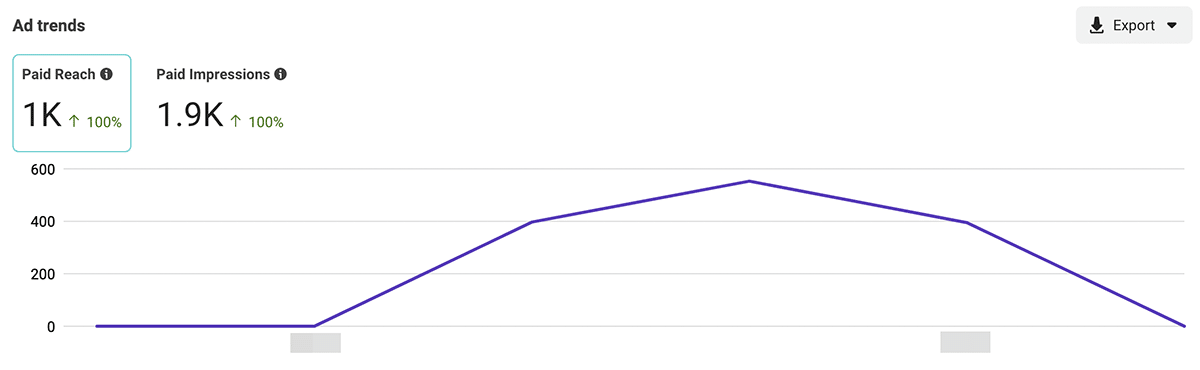
In Business Suite, you can also find basic paid reach statistics. Scroll to the bottom of the Results tab to see the Ad Trends section.
You can see total paid reach and a chart that reflects paid reach over the selected time period.
On the Content tab, Business Suite automatically highlights the post with the highest paid reach. But this tool doesn’t show reach for each paid post.
To see more detail, it’s typically best to use Facebook Ads Manager instead.
Find paid reach in Facebook Ads Manager
For comprehensive reach metrics on all your paid campaigns, Ads Manager is your best bet.
When you log in, the Ads Manager interface displays reach by default, making this metric easy to find. But with a few clicks you can customize columns to make reach and other metric seven more accessible.
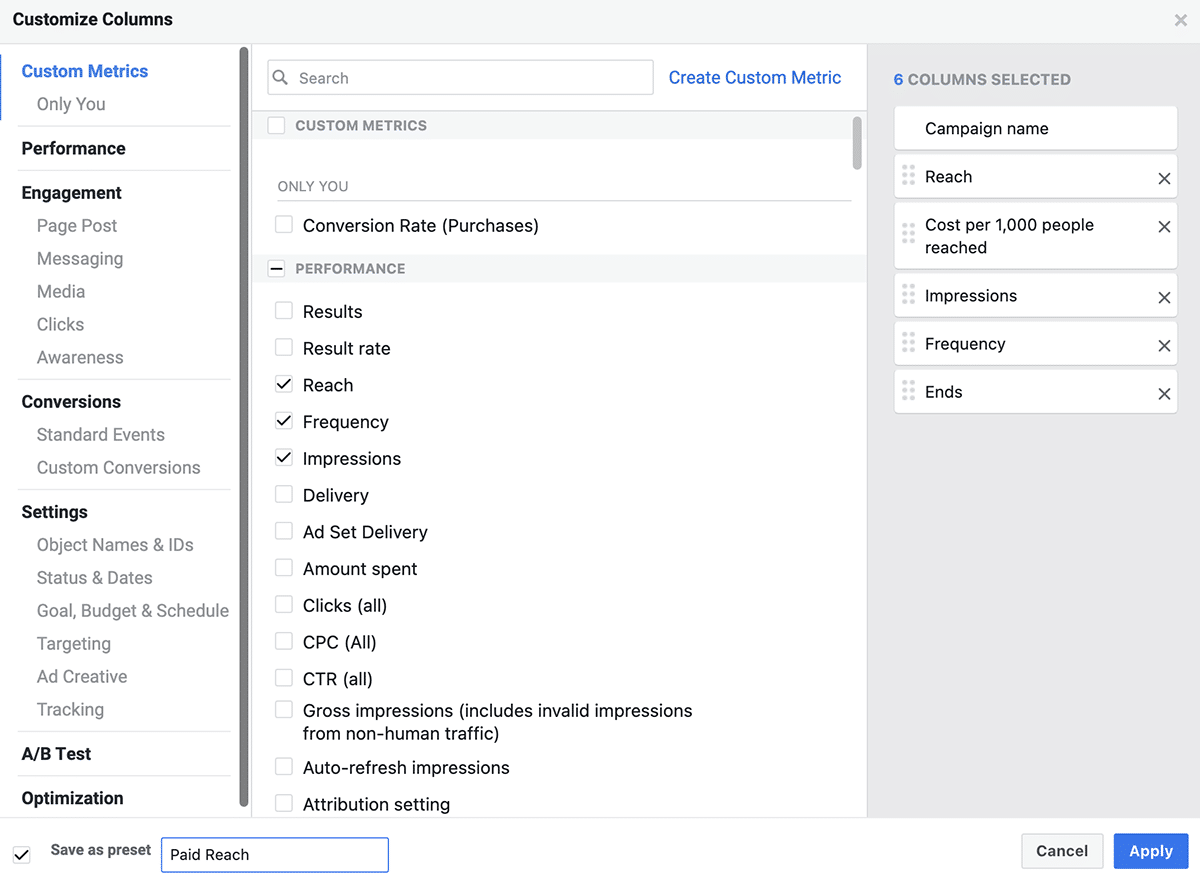
Click the Columns button and select Customize Columns. Then drag and drop metrics until they’re in the order that’s most efficient for your team.
For example, you may want to add reach and cost per 1,000 people reached to the top of the list so you can see them first. Click Save as Preset so you can quickly access these columns again.
You can use customized columns to access paid reach at the campaign, ad set, and ad level, which provides useful insights. But if you need even more detail, click the Breakdowns button to analyze reach by audience demographics, platform, placement, or action.
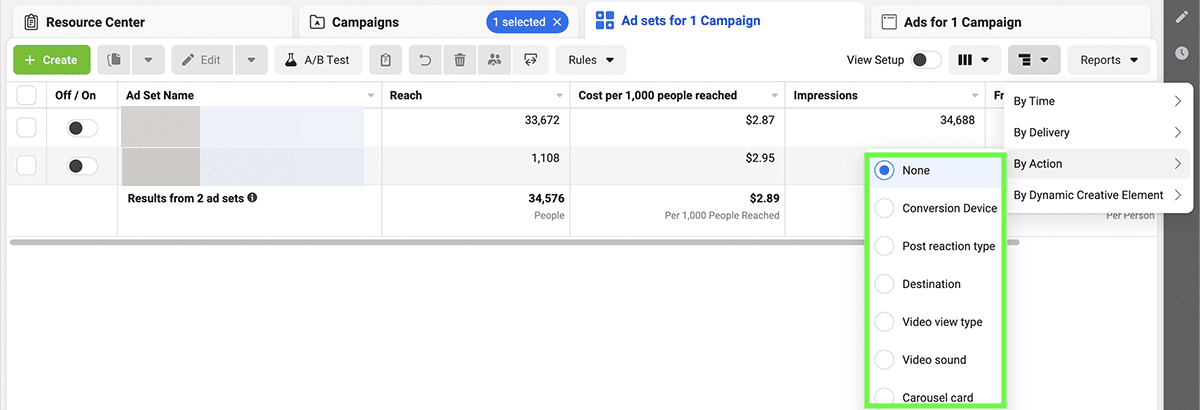
You can see which segments your ads reached and get insight into which are the least and most expensive to reach. If you add Results and other key metrics to your breakdown, you can learn even more about the best audience segments to target.
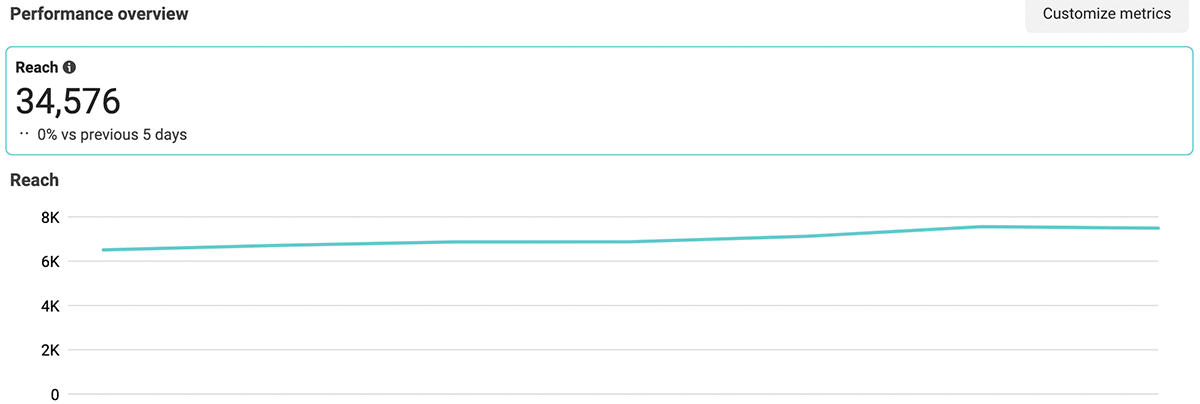
To see how paid reach has changed over time, click the chart icon in the upper right corner of Ads Manager. Although these charts don’t provide much customization, they make it easy to spot patterns and identify potential issues with your campaigns—such as ad fatigue.
To see more data visualizations, click the Reports button in Ads Manager.
Select Create Custom Report to translate your custom columns to a chart, and then toggle the view to Trend.
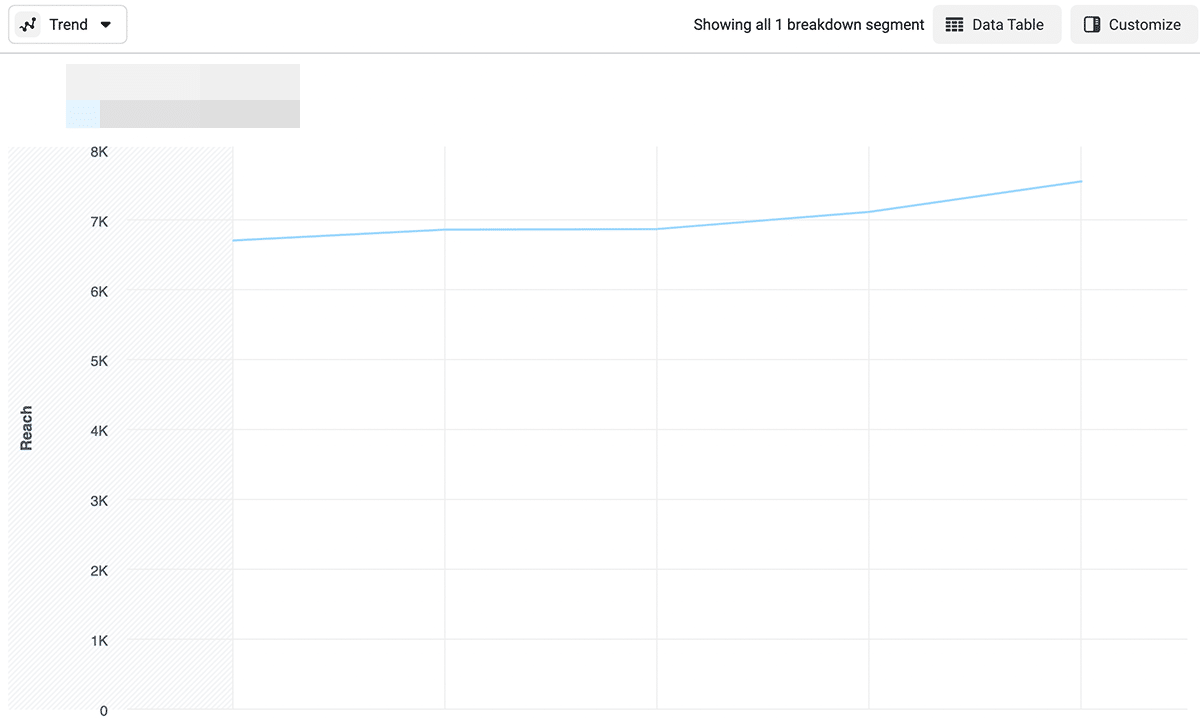
You can add and remove metrics and breakdowns to provide more context for your report and help your team make more informed decisions.
When you’re finished, save your custom report so you can access it quickly later.
What We Learned About Facebook Reach Statistics
Analyzing Facebook reach statistics may have seemed impossible when you started reading this article. But now, you know more about where to focus, what to focus on, and how to get the Facebook reach statistics you need, such as:
- Page reach
- Post reach
- Ad reach
Want to start tracking all your important social media metrics in one place? Check out a free trial of Agorapulse to help you schedule, track, and measure all your social media marketing efforts.


