

Whether you manage just one or dozens of Facebook Pages, you need a way to track and analyze performance. But which Facebook metrics matter most and how can you monitor them most effectively?
Get to know the most important Facebook metrics and find out how to track and analyze them in your social media reporting dashboard.
Why Do Facebook Metrics Matter?
Publishing the same kind of Facebook content or repetitive Facebook Ads campaigns might get decent results for a little while. But the Facebook algorithm is continuously evolving.
So is your audience.
To find out what’s working now, you have to stay on top of your brand’s Facebook metrics.
Monitoring metrics can help you:
- Reach your team’s social media goals, which can be anything from increasing brand awareness to driving website traffic.
- Identify what drives the best results (and what performs the worst) so you can do more of what works.
- Overcome declining Facebook organic reach and other algorithm challenges so you can reach your audience effectively.
Facebook Page Metrics
How is your Facebook Page performing overall? Tracking Facebook Page metrics can help you determine if your page is growing as quickly and connecting with as many people as your team would like.
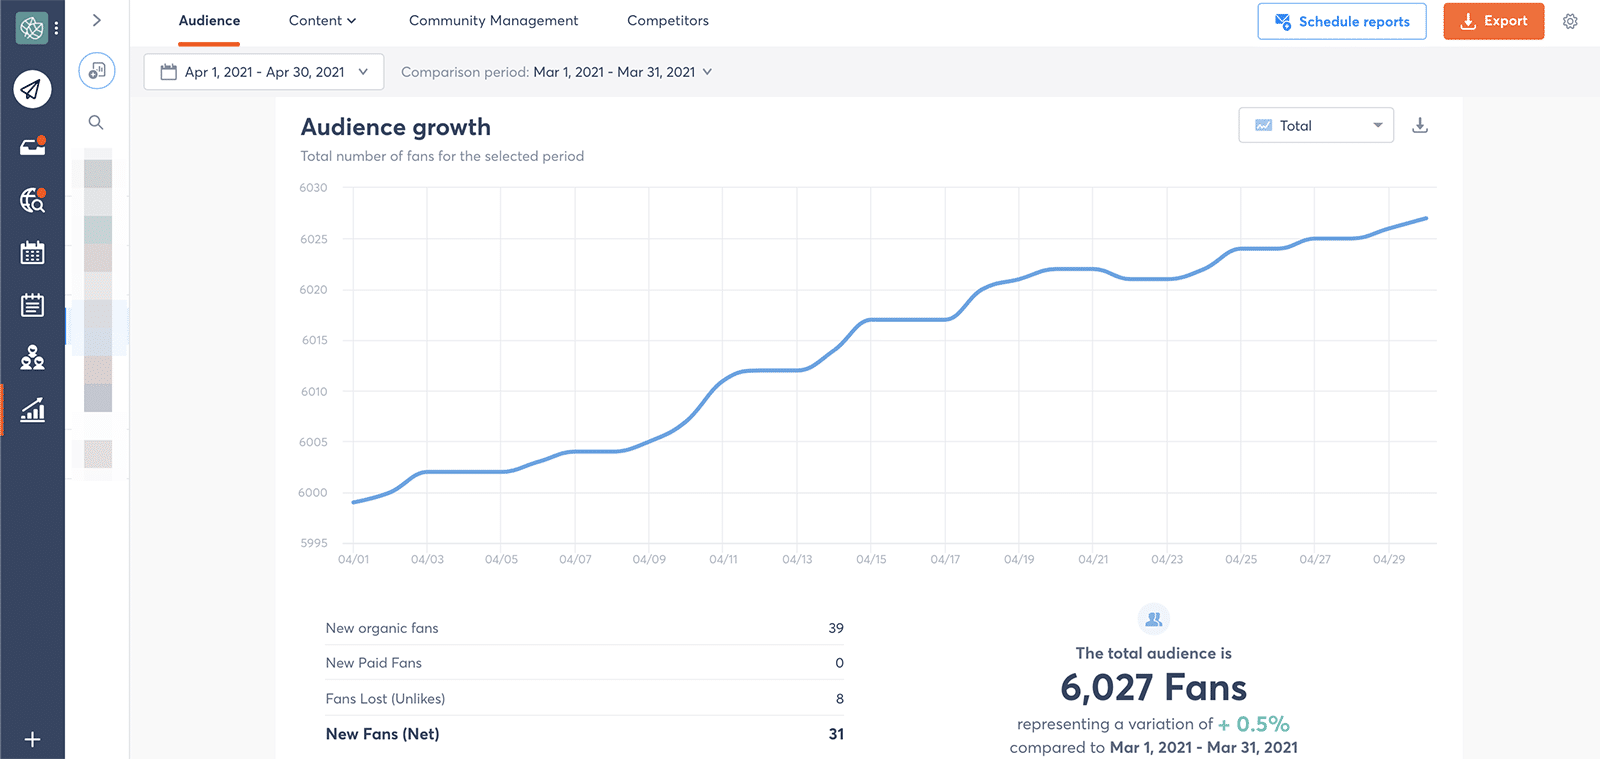
Audience growth
Audience growth reflects the Facebook followers you’ve gained or lost over a certain time period.
When you track growth weekly or monthly, you can ensure that your profile is gaining new followers at a steady clip and avoid hitting any plateaus.
With Agorapulse’s audience growth report, you can chart the total size of your following over time.
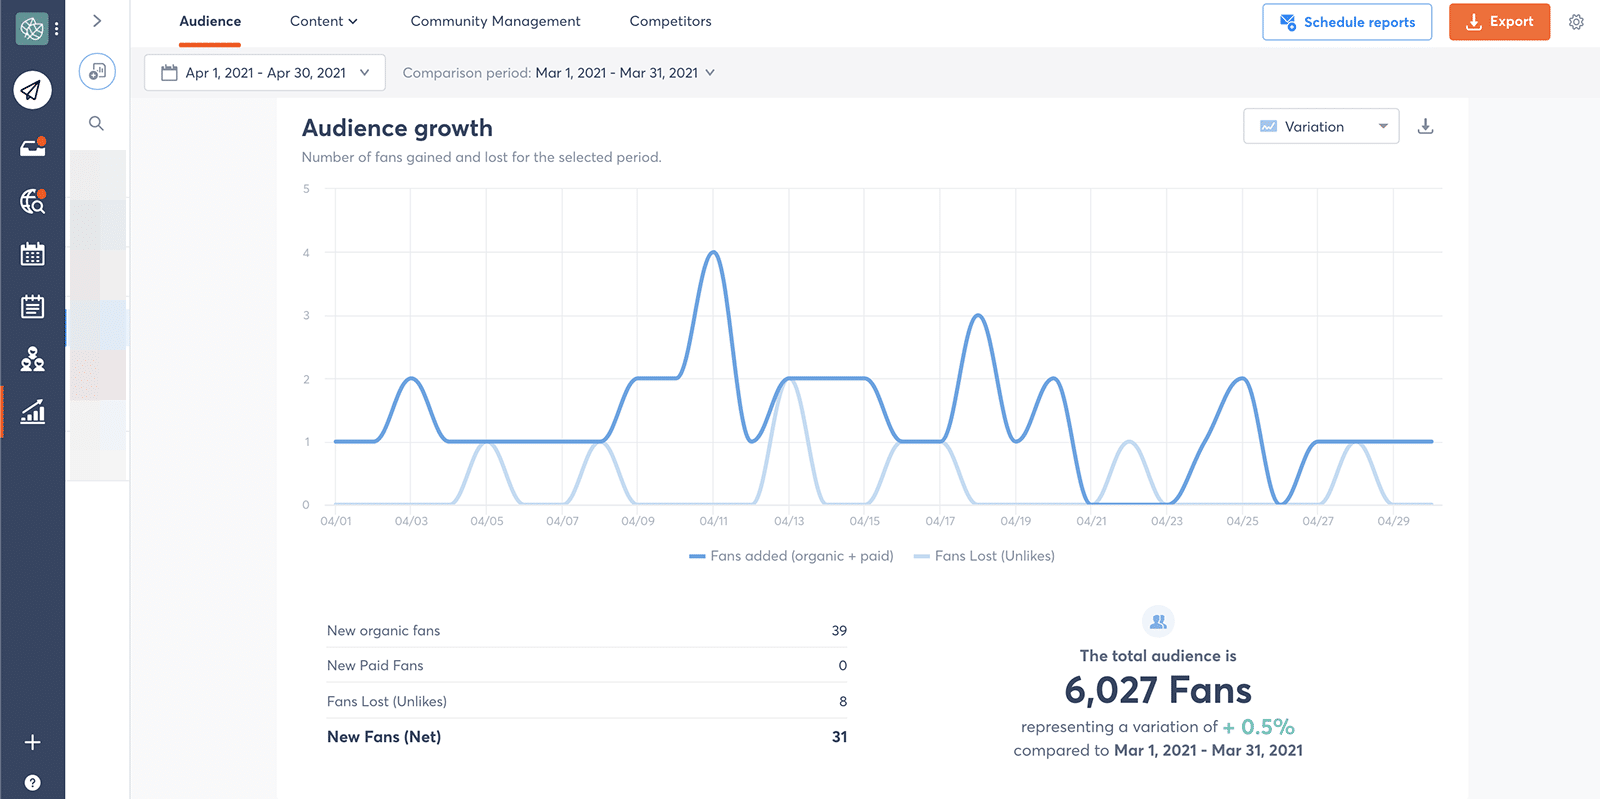
Toggle the dropdown menu to chart follower variations over time. You can see how many followers you’ve added or lost each day and pinpoint unusual activity.
For example, you can quickly spot days when you gained or lost more followers than normal. Then you can do some research to determine whether something you said or posted caused the spike.
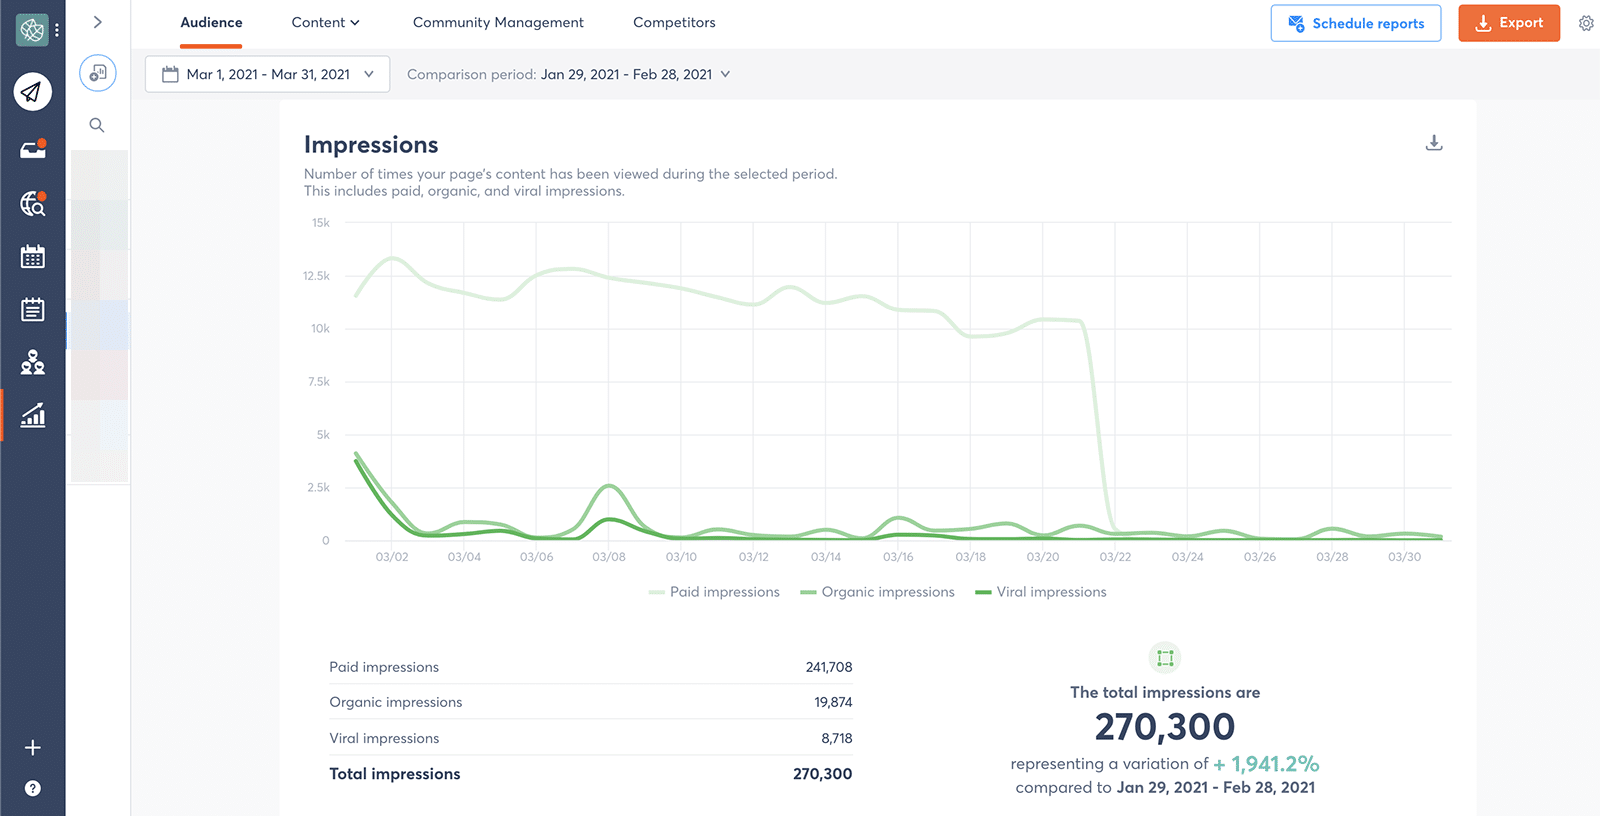
Facebook impressions
Impressions reflect how many times people viewed your Facebook content.
The Agorapulse audience report charts your Facebook Page’s impressions over time and breaks down this metric into a few helpful categories:
- Organic impressions come from all your unpaid content.
- Paid impressions result from your Facebook Ads.
- Viral impressions happen when your followers’ engagement with your content causes it to appear on their friends’ timelines.
When you want as many people as possible to see your content, tracking impressions is particularly helpful. Identify the days with the highest impressions and then look back at what you posted on those days. Can you publish more content in this vein?
10 types of social media content to fill your calendar
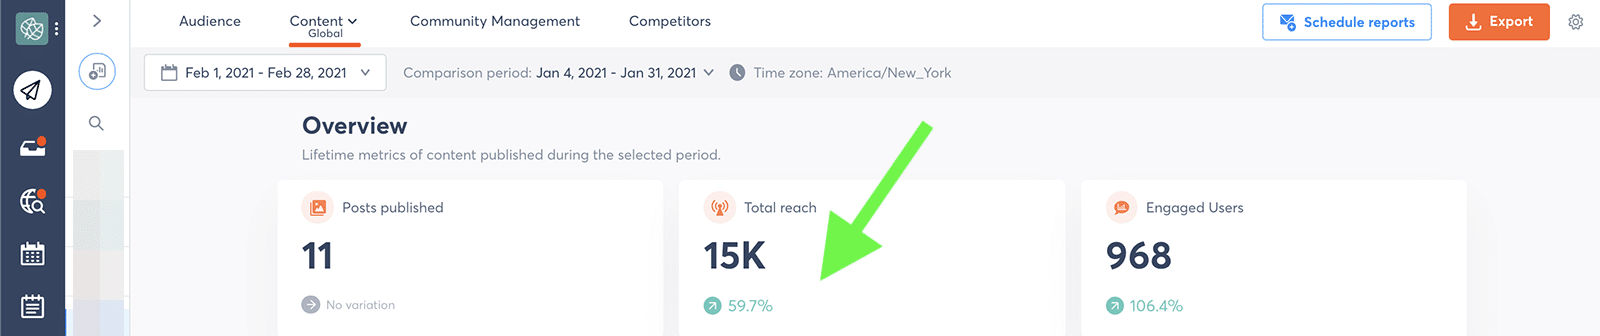
Facebook reach
Reach is the number of unique Facebook users who saw your content.
Like impressions, reach helps you get a sense of how successfully you’re spreading the word about your brand.
Agorapulse content reports track total reach for your account, so you can gauge success with a quick glimpse.
The dashboard also collects reach data for individual posts. You can see both organic and paid reach for any post to determine which strategy is driving the best results.
Facebook Content Metrics
What about your Facebook Page’s content performance? Those metrics are designed to give you a top-level view of the content your team publishes.
Publishing metrics
Facebook publishing metrics reveal the various types of content you post throughout a time period.
The Agorapulse content report dashboard totals all the posts you published during a certain time frame. Agorapulse also automatically tracks four types of content: links, photos, videos, and statuses.
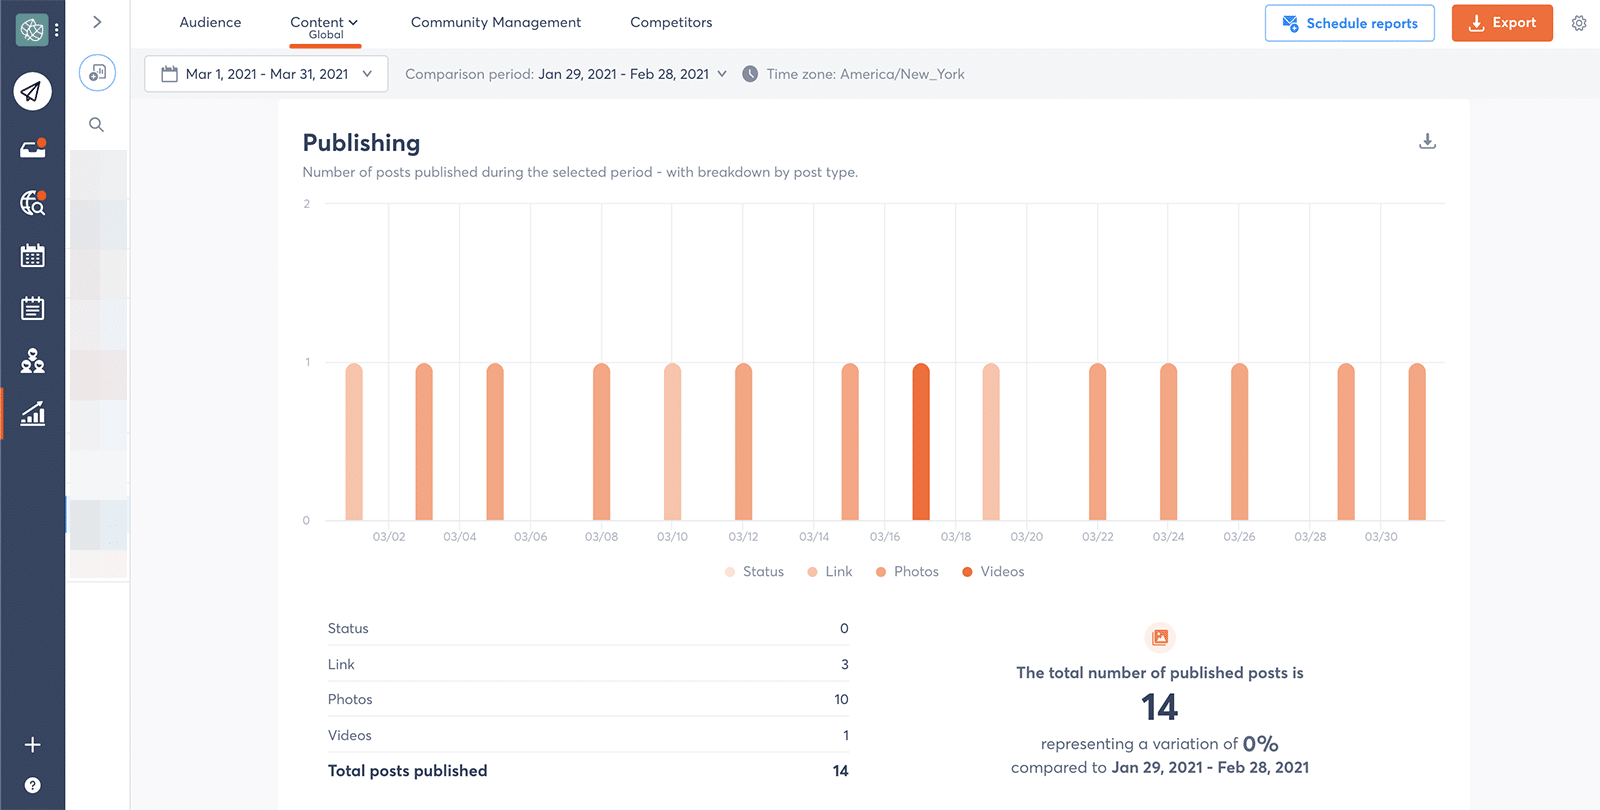
You can view content type by day or review the total for the time period. With this report, you can also compare your publishing frequency to the previous period.
Top content
By tracking your top-performing Facebook content, you can gain a better understanding of what your audience likes and what drives the results your team wants.
The Agorapulse report dashboard displays your top posts so you can quickly see what’s working.
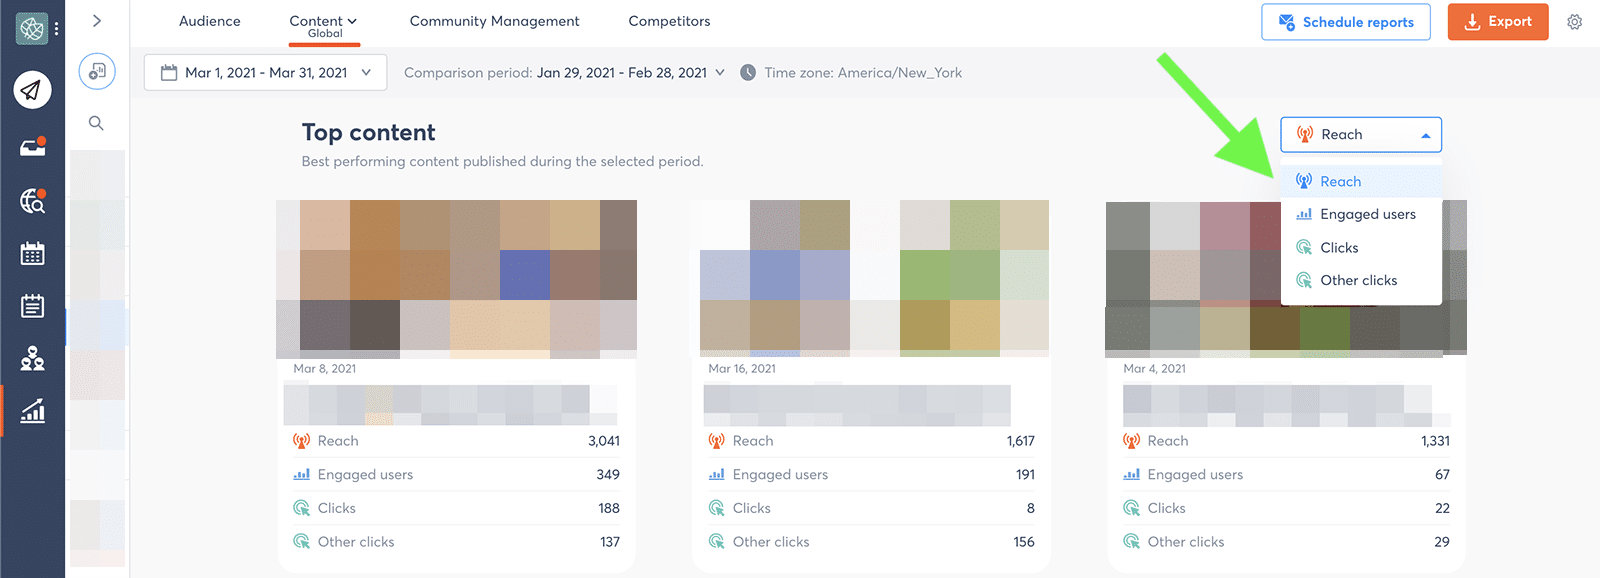
By default, Agorapulse prioritizes content by reach. However, you can toggle the menu and view top content by engaged users or clicks instead.
So you can focus on what matters to your team.
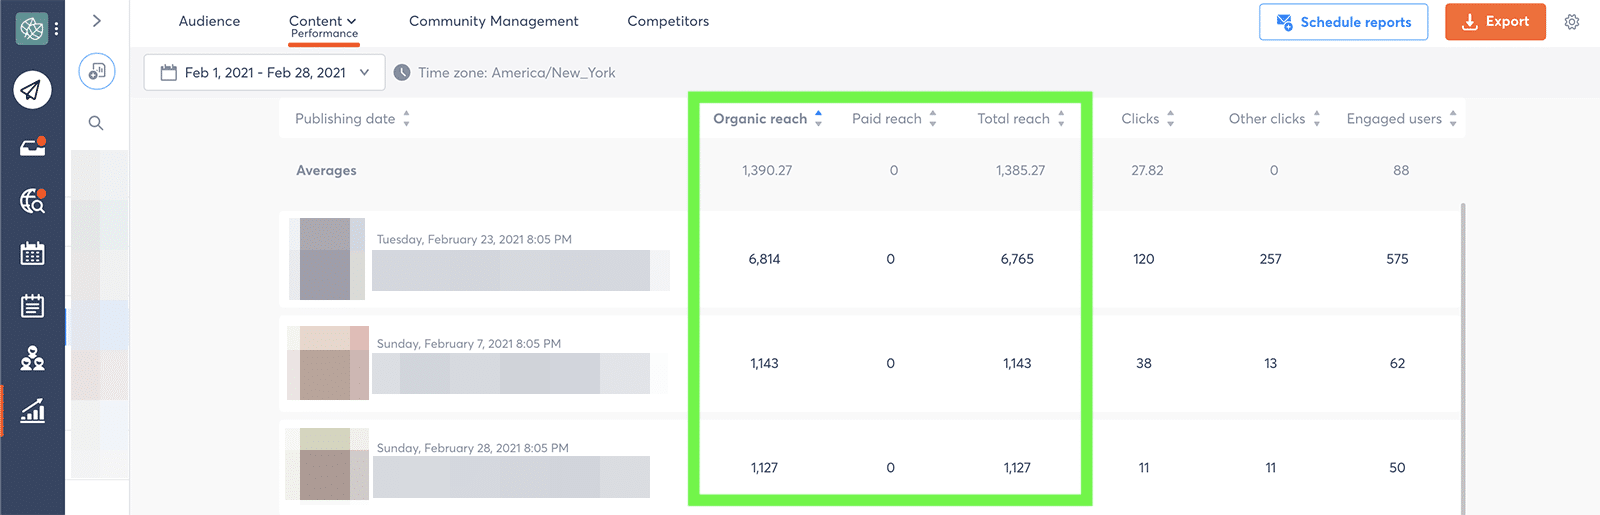
Post performance
To compare results from all the content you posted during a certain time frame, check your post-performance metrics.
This Agorapulse report nicely displays key Facebook metrics, including:
- Organic reach
- Paid reach
- Clicks
- Engaged users
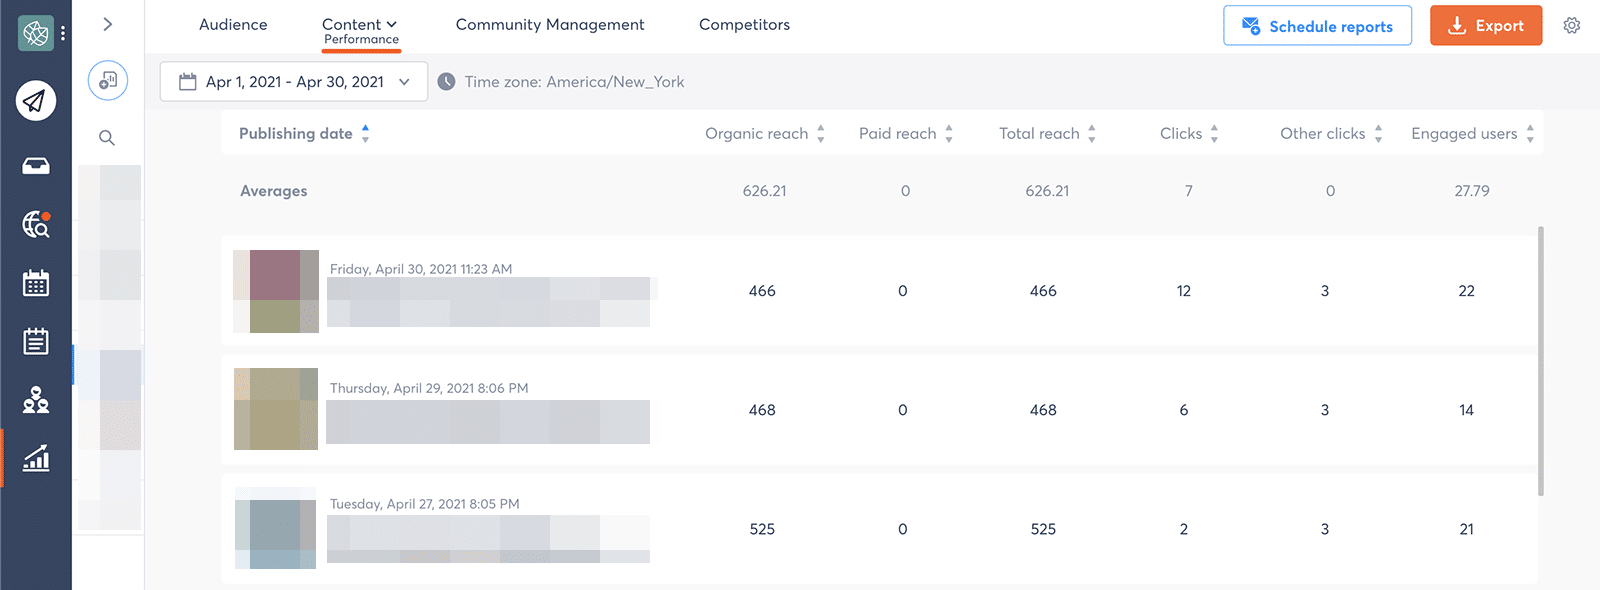
You can click to sort by any of the available metrics. That means you can quickly find which post generated the highest reach, the most clicks, or the most engaged users.
Recommendations
Facebook metrics help you understand what happened in the past–but that’s not all. They also help you optimize your strategy for the future.
Agorapulse’s recommendations leverage your data to suggest what to do in the future to get the best results.
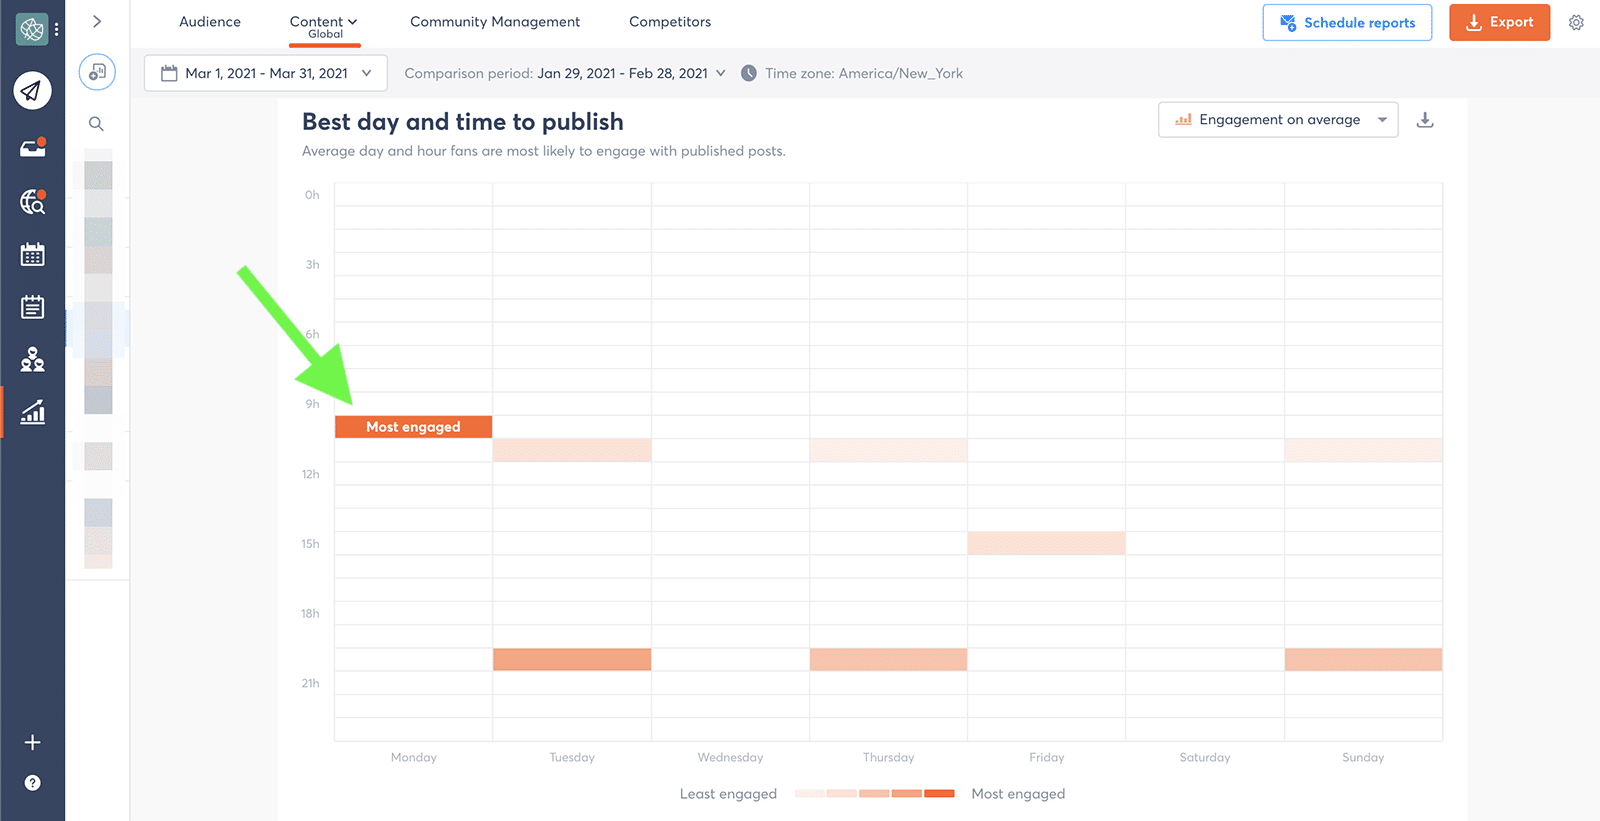
The dashboard automatically recommends the best time to post on your Facebook Page. You can get recommendations based on the highest reach or the best engagement to meet your team’s goals.
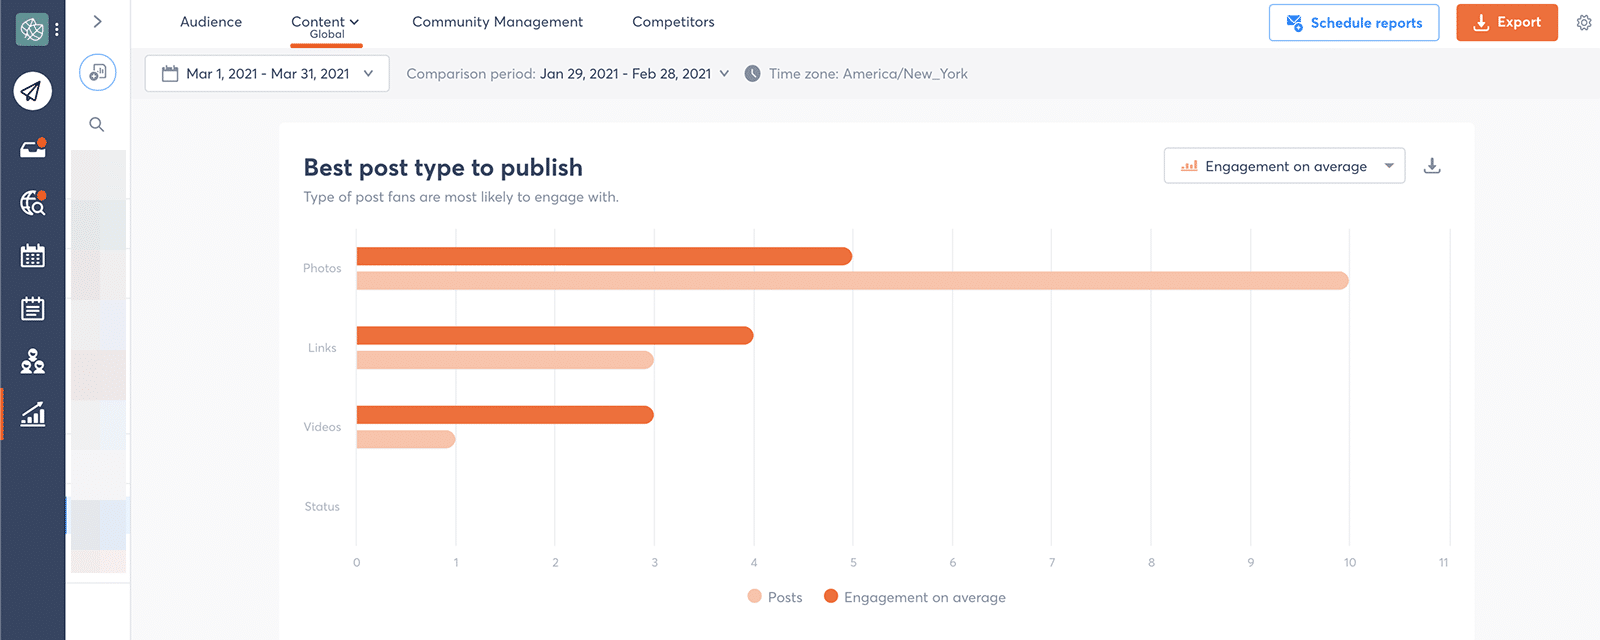
Agorapulse also recommends the best type of post to publish based on your performance metrics.
You can easily see which type of content generates the most engagement or the highest reach–and use that analysis to plan your content calendar.
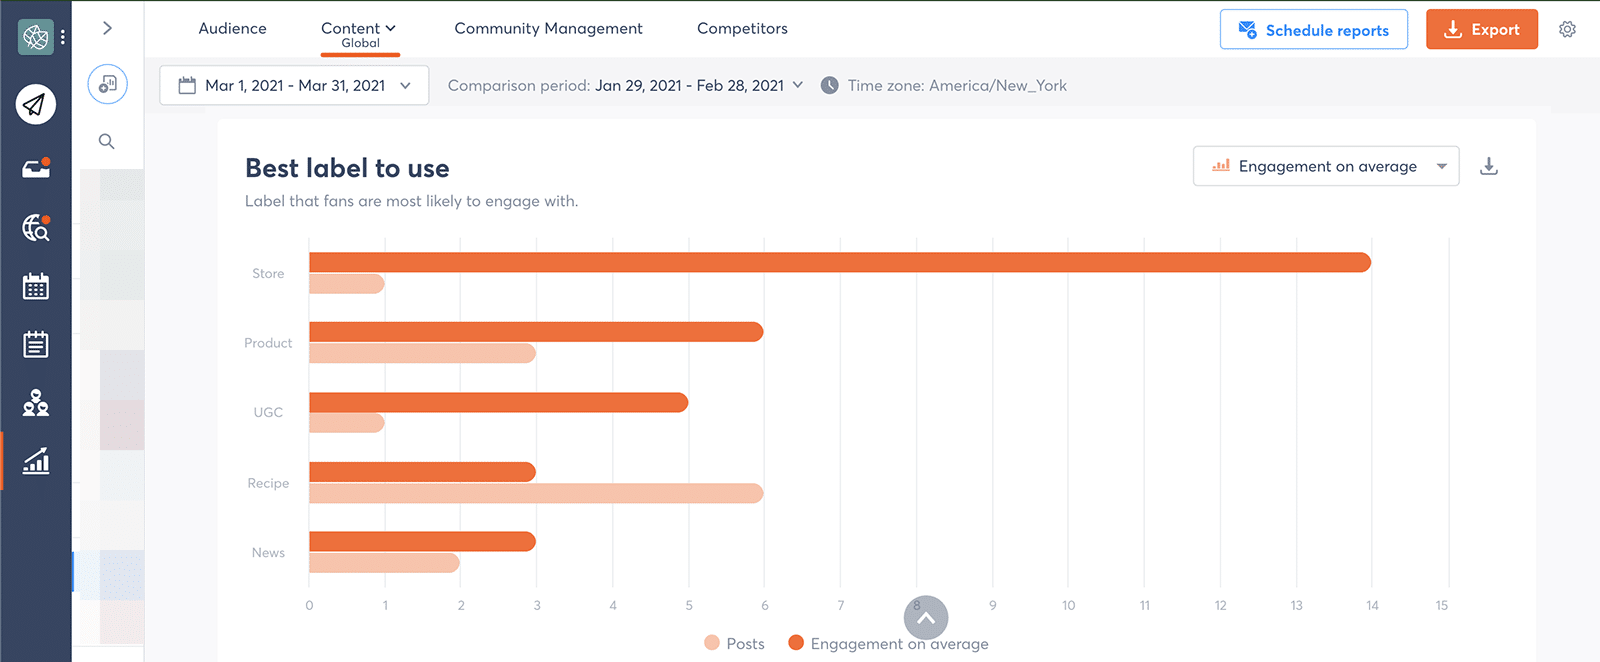
If you label the posts you publish via Agorapulse, you can also access recommendations for the best categories to pursue in the future.
Just navigate to the Agorapulse settings for your Facebook Page to create your choice of content labels.
Facebook Engagement Metrics
Are your Facebook followers interacting with the content you publish–or are they mostly ignoring it? By monitoring engagement metrics, you can make sure your audience is responding the right way.
Reactions
Facebook reactions offer a good indication of how many people are casually engaging with your content.
Agorapulse reports give you an overall look at the total number of reactions your Facebook Page received over a certain period of time.
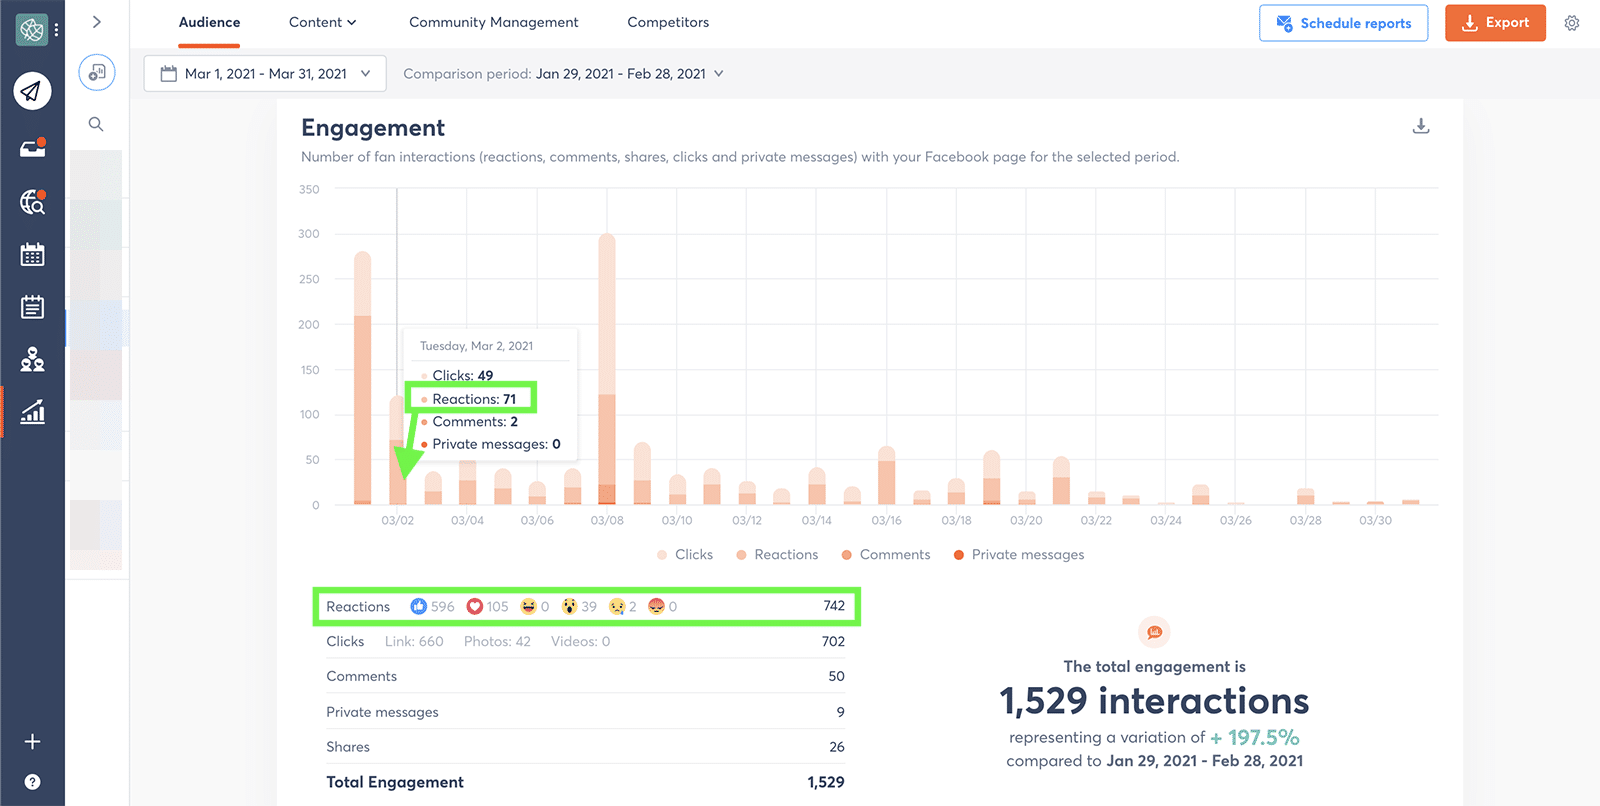
You can see a breakdown of all available reaction types, including like, love, laugh, wow, sad, and angry. You can hover over any date on the chart to see how many reactions your content received that day.
Comments
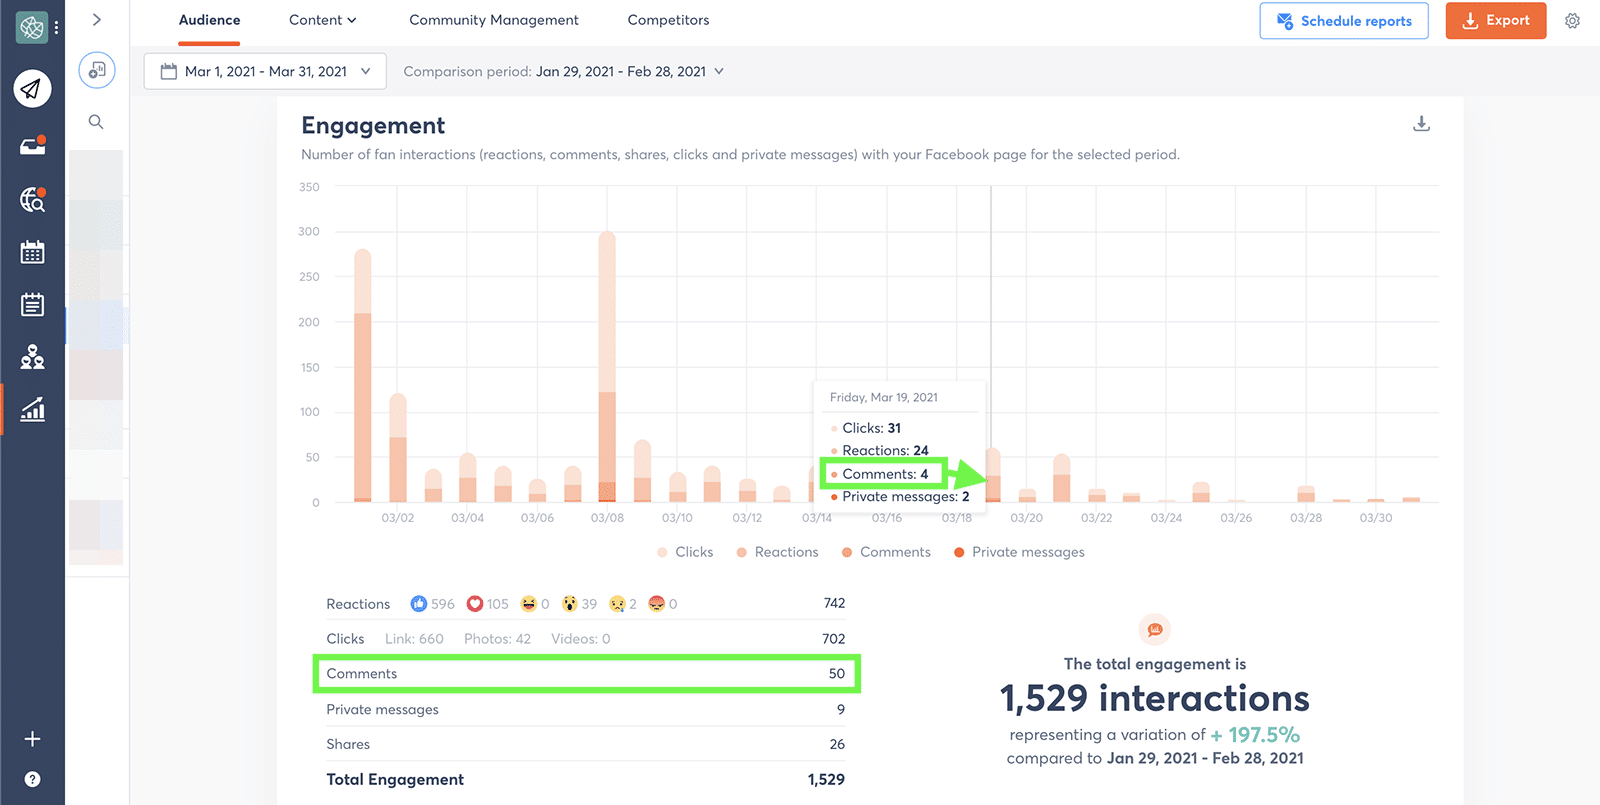
Comments reflect a higher level of engagement than reactions, making them an important metric for most brands.
Agorapulse automatically tallies the total number of comments your Page receives during any period. You can also see a daily tally by hovering over any date on the chart.
Private messages
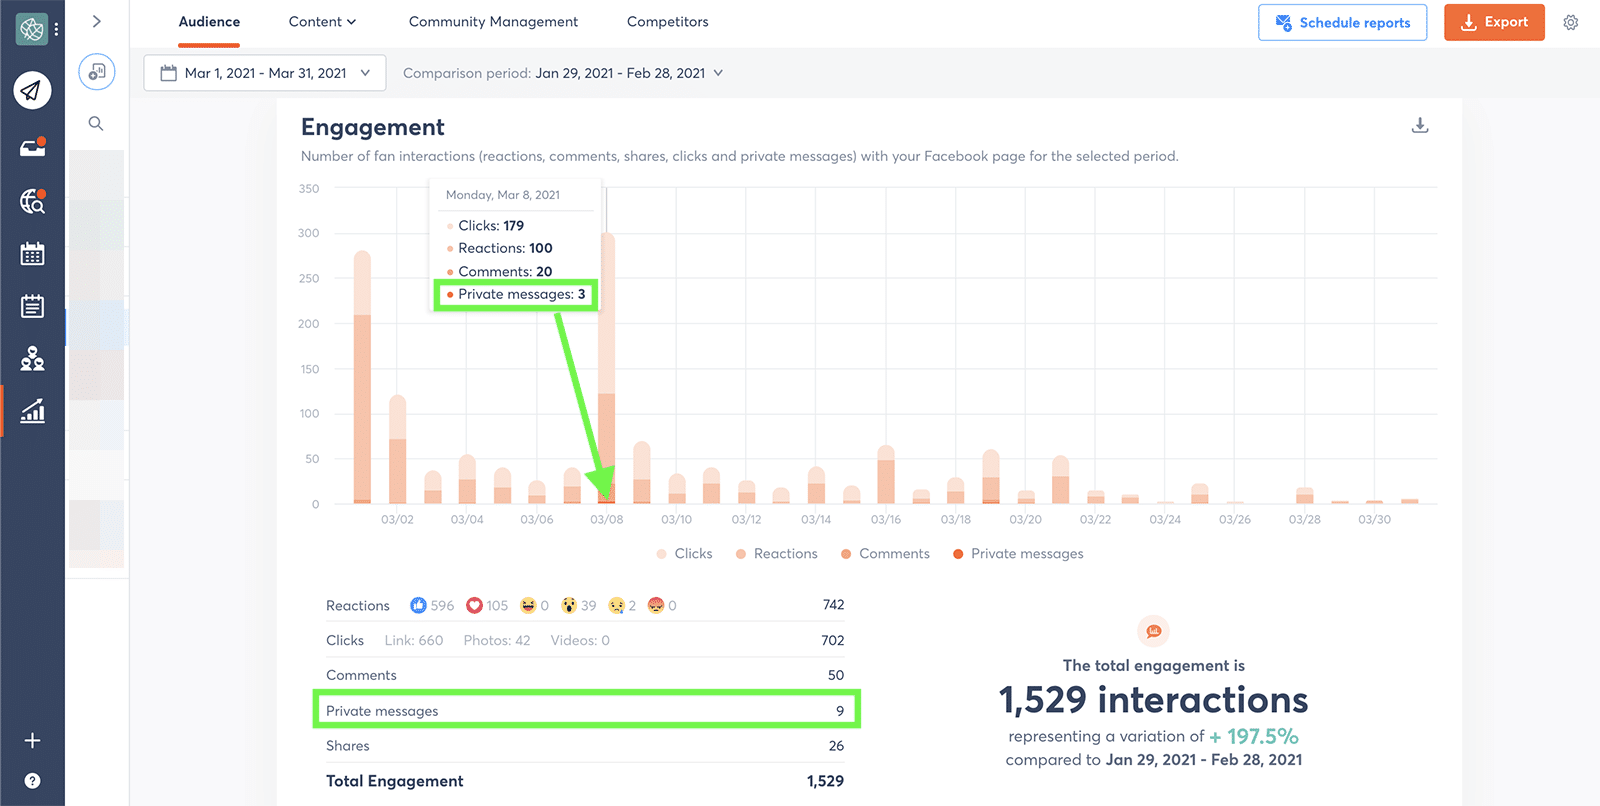
Private messages allow followers to send your Page more personal notes–for example, if they want to know where to find a product in their area or they need customer support.
Agorapulse delivers your brand’s private messages to your Social Inbox and tracks them in the engagement reporting dashboard, where you can find your Page’s overall total.
Shares
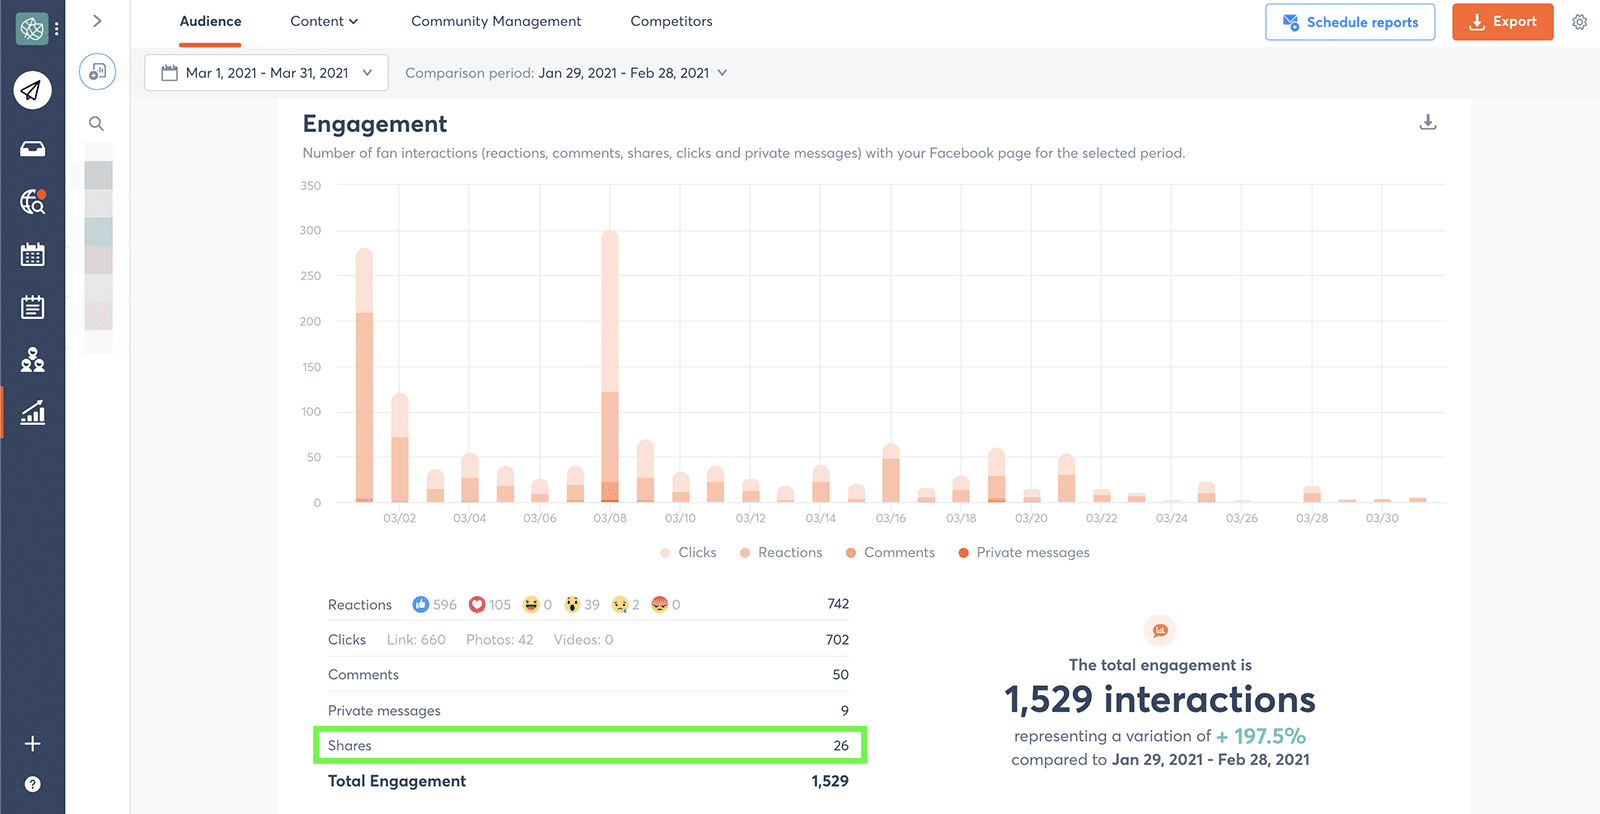
Shares indicate that a follower reposted your Page’s content onto their own timeline. They also suggest that followers want to associate themselves with your brand, making them a critical metric for brand awareness. Agorapulse automatically tracks shares on engagement and brand awareness reports so you can factor this metric in everywhere that matters.
Clicks
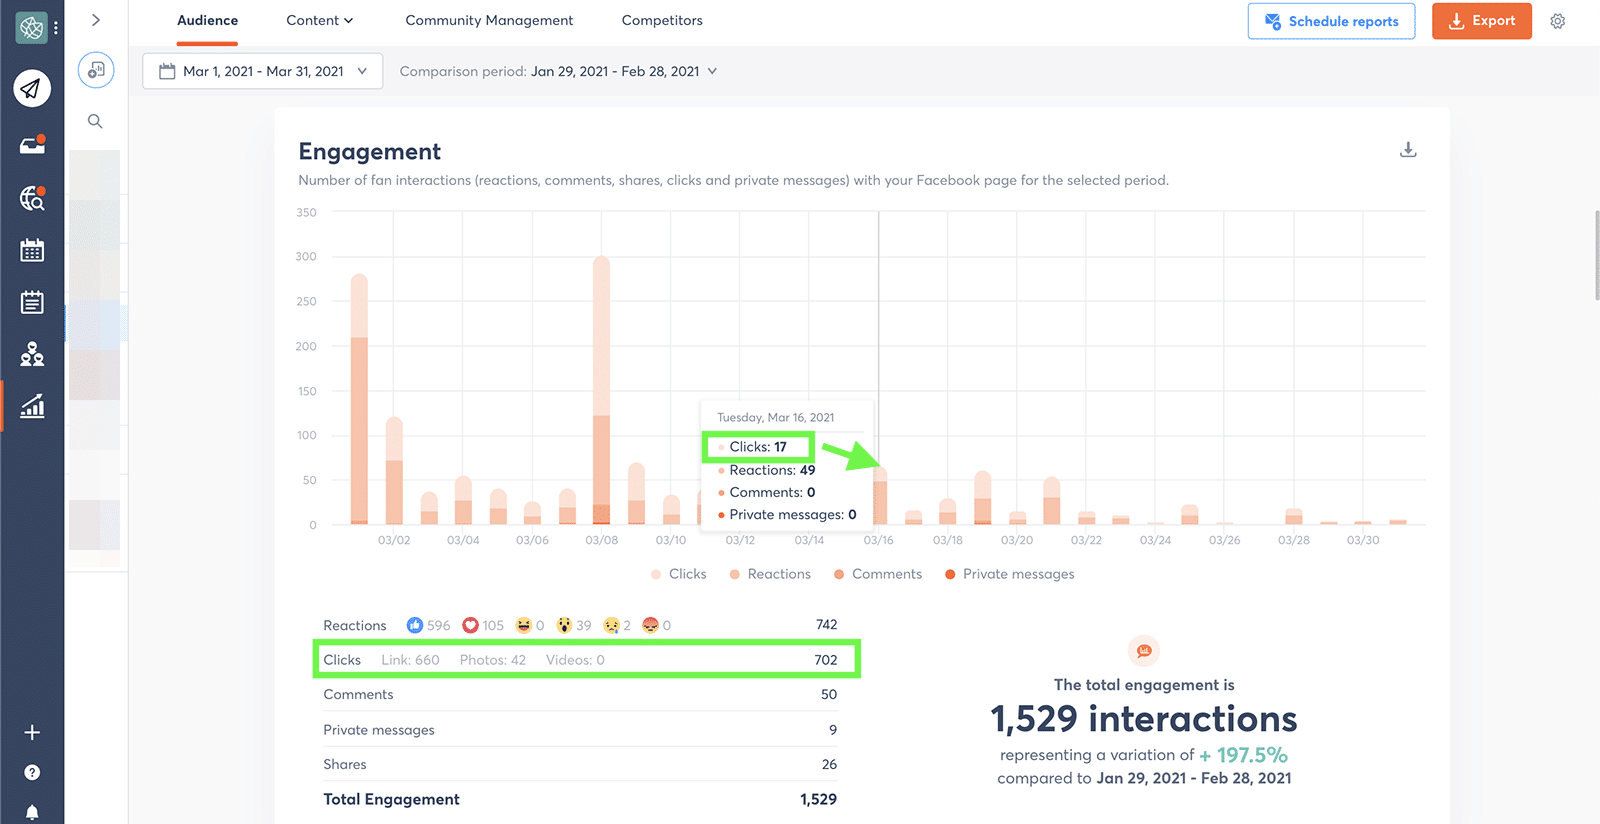
Clicks happen when someone taps on content you shared to learn more or to follow a link. The Agorapulse engagement report breaks down clicks into three categories: links, photos, and videos.
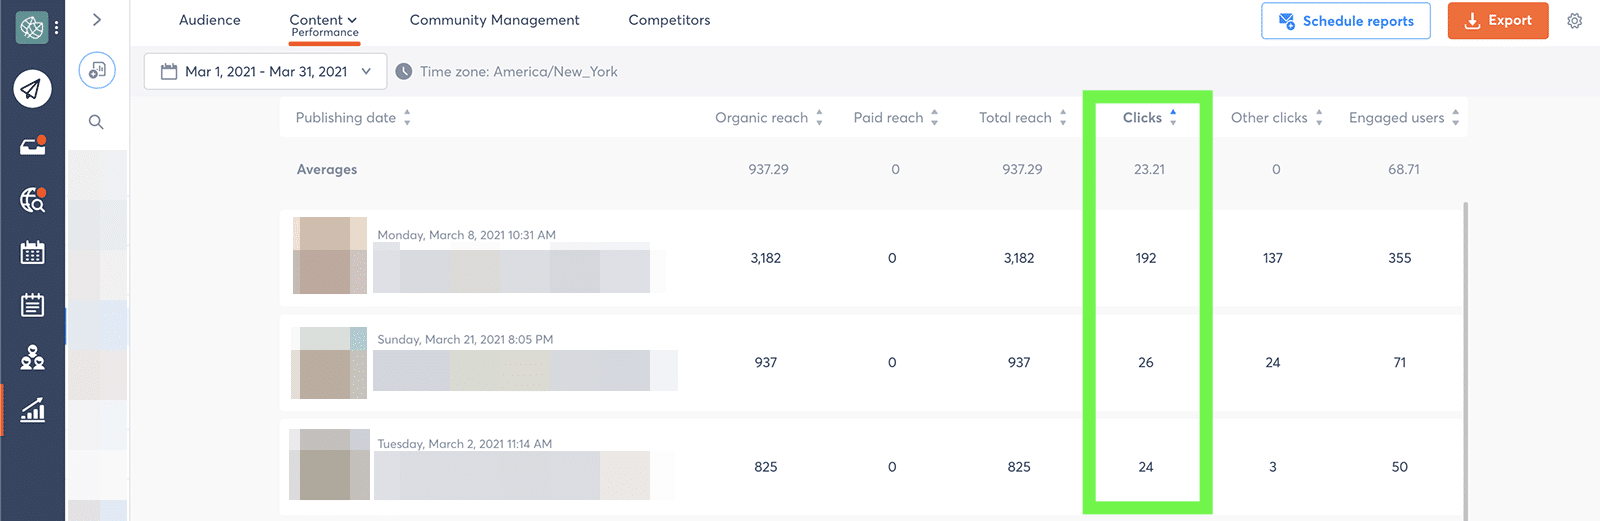
For a closer look at clicks per post, go to the content report. You can sort by clicks to find high-performing posts easily.
Referrals
If your Facebook followers visit your website by clicking a link you shared, you can continue to collect useful data.
Referrals are website visitors who came from another site–such as your Facebook Page–and analytics platforms like Google Analytics track this metric automatically.
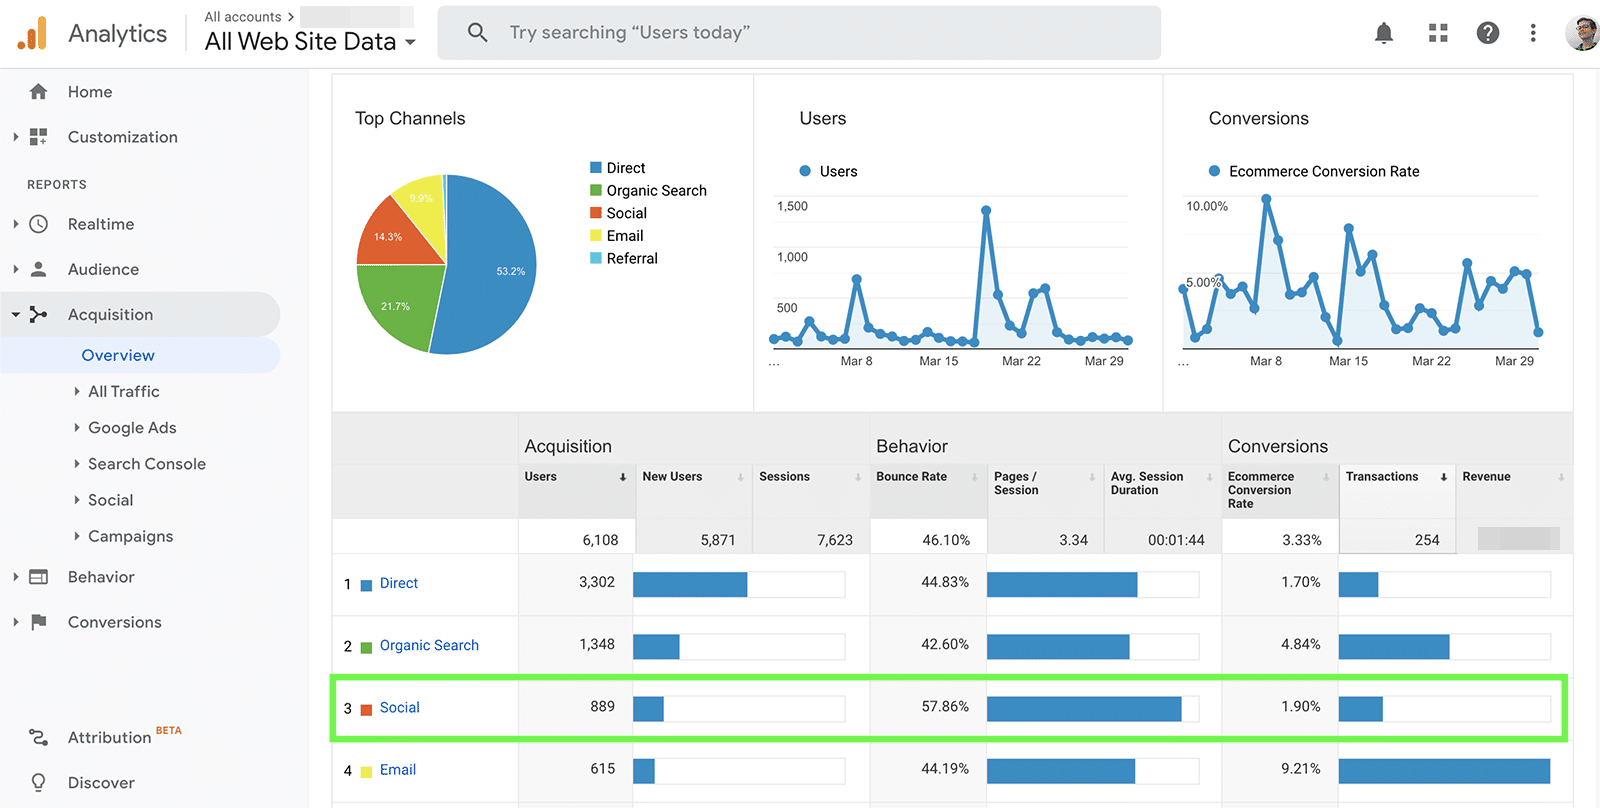
With Google Analytics, you can also get data on which pages your Facebook referrals visited, how many conversions they generated, and even how much e-commerce revenue they generated.
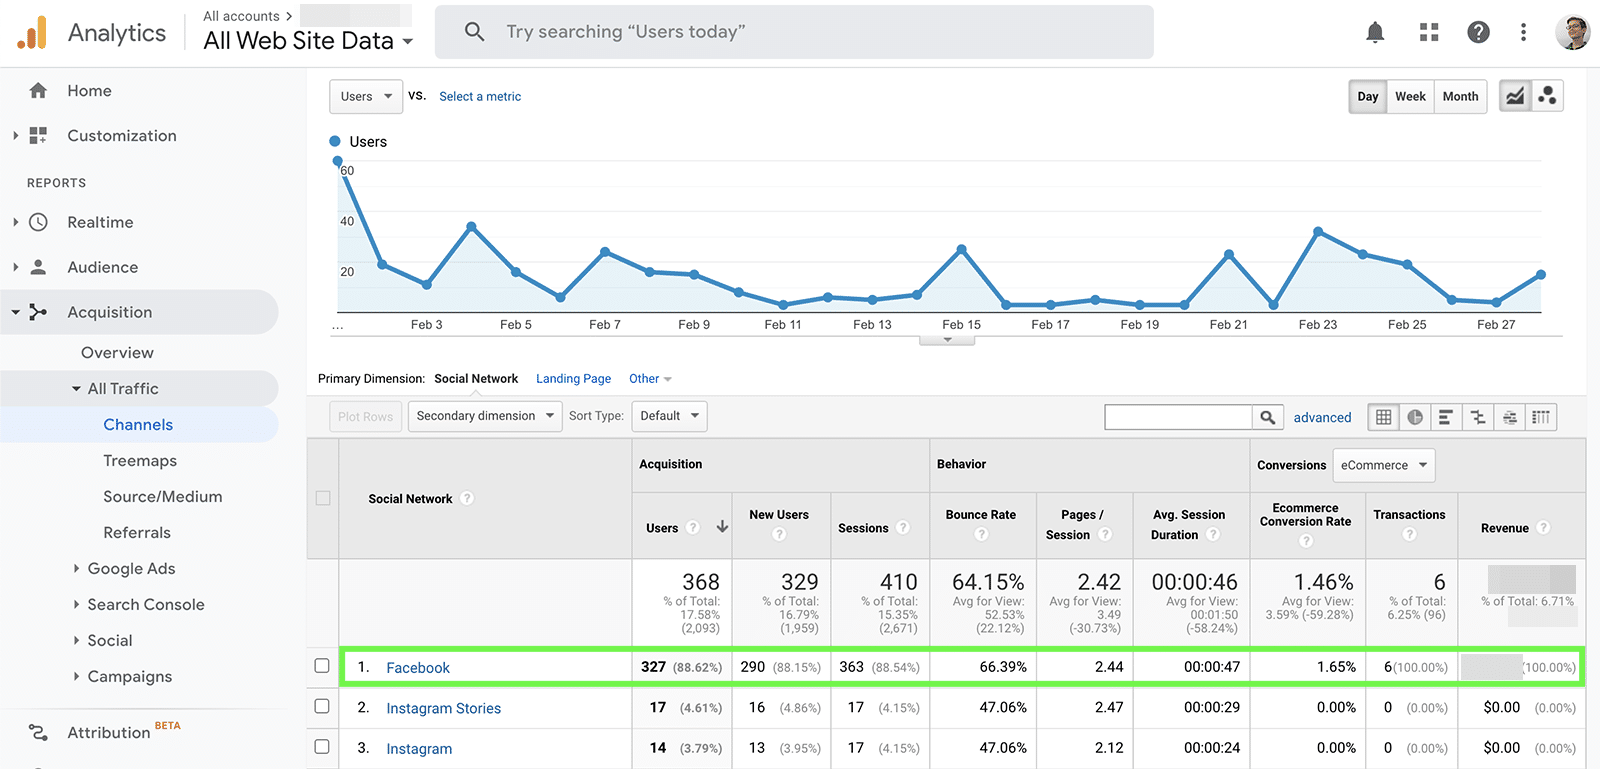
If you create UTM parameters for the Facebook posts you publish with Agorapulse, you can get even more granular. Using this data, Google Analytics can show you which posts or campaigns drove the most traffic or revenue, which can inform future content planning.
Facebook Video Metrics
Does your audience watch and engage with the video content you post?
With these video metrics, you can ensure your content has the desired effect–whether you want to entertain, inform, or convert.
Tips for creating videos that get attention the right way
Video engagement
To monitor video engagement, check your Agorapulse content report. For any video post, you can see reach, clicks, and engaged users.
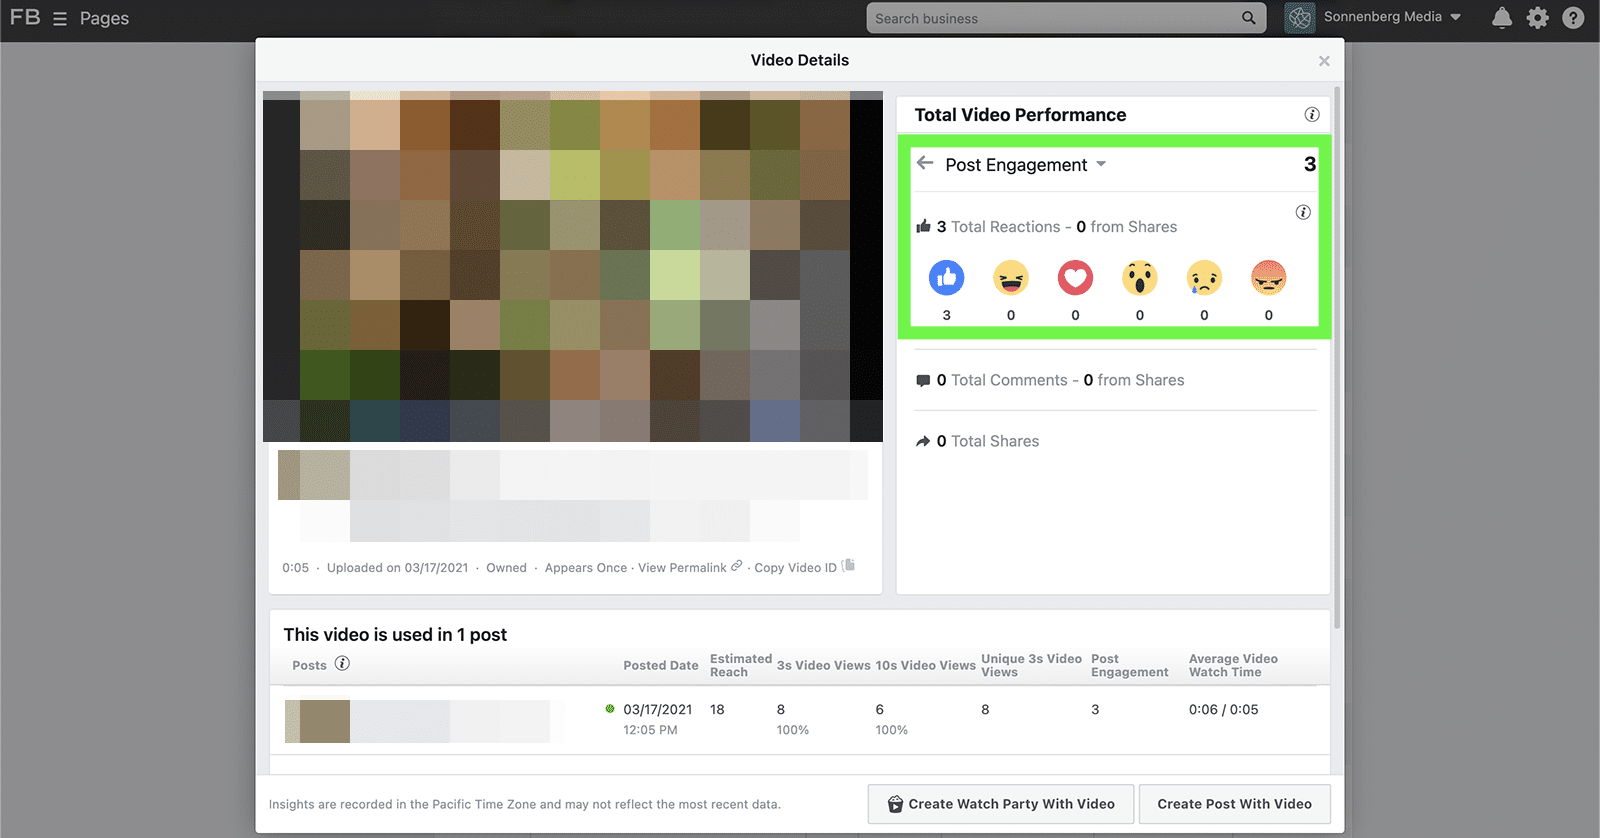
You can also access these analytics in Facebook Insights. There, you can get a breakdown of reactions, comments, shares, and clicks.
You can also track the engagement rate to get a big-picture view of what works best for your audience.
Video retention
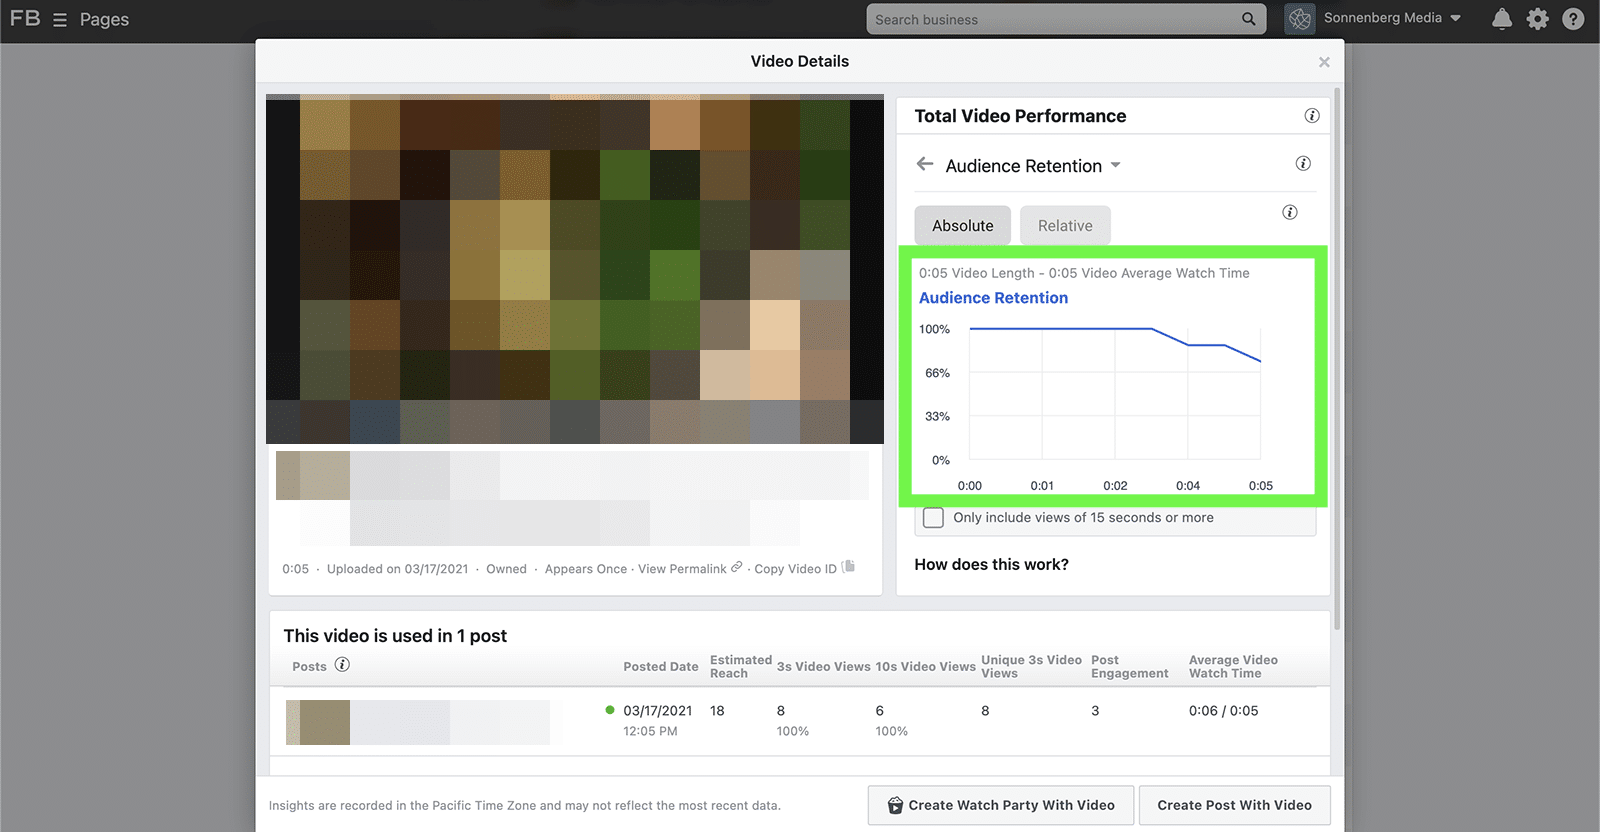
After you post video content, you need to know how long your audience watches and when they typically click away. Facebook Insights automatically tracks audience retention, calculating how many 3- and 10-second views your videos get as well as the average watch time for each one.
Facebook Social Listening Metrics
Are you listening to hear what people are saying about your brand on Facebook? Social listening can be tricky because the Facebook API limits what you can track.
For example, the Agorapulse social listening dashboard can pull in mentions from public posts only, not from post comments. To stay on top of the conversation, you need these social listening metrics.
Mentions
Mentions happen when someone talks about your brand publicly on Facebook. Monitoring mentions is a great way to gauge the number and scope of conversations about your business and can help you assess brand awareness.
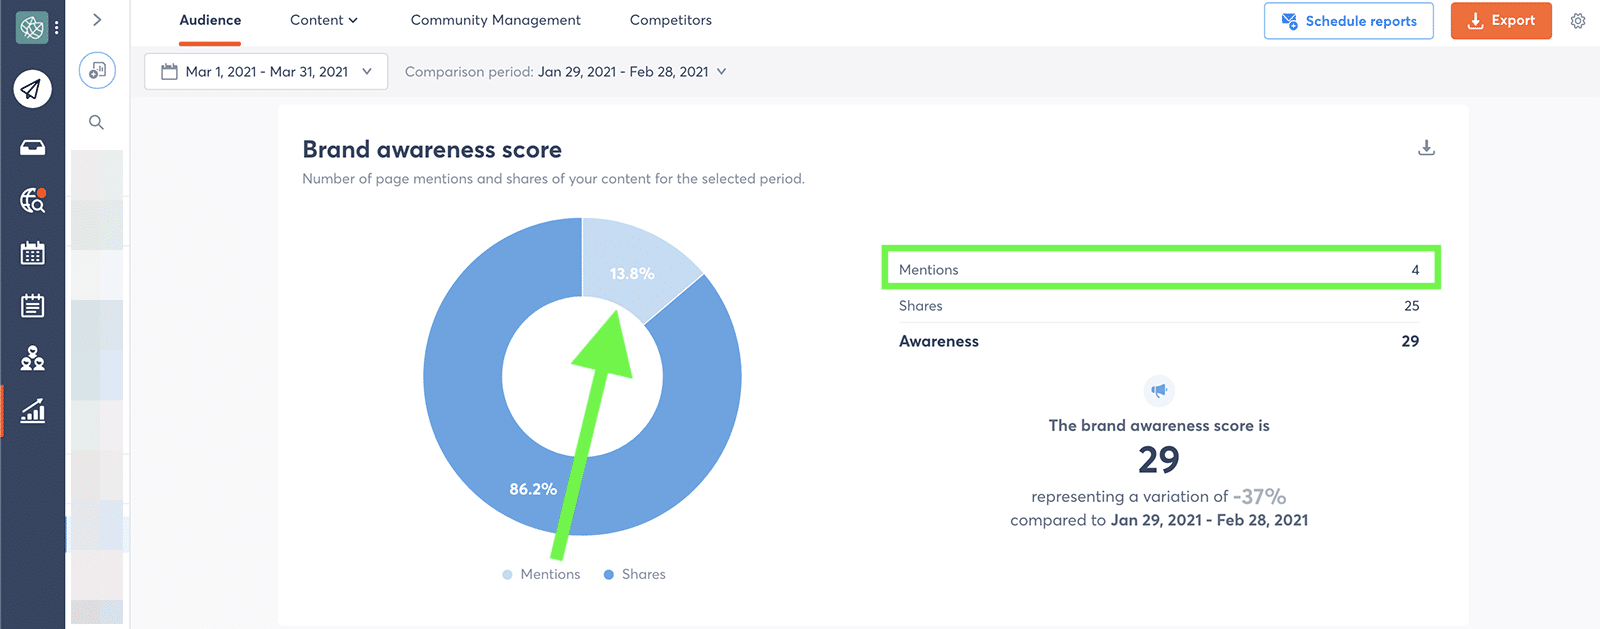
Agorapulse automatically tracks direct mentions, which include your @username, and tallies them in your audience report. You’ll find them in your brand awareness score, which also reflects the number of shares your content generated.
Sentiment
Do Facebook users have a good or a bad opinion of your brand? Measuring sentiment helps you understand how customers feel about your brand. Tracking this metric can also help assess how customer opinion changes over time and can alert you to problematic trends.
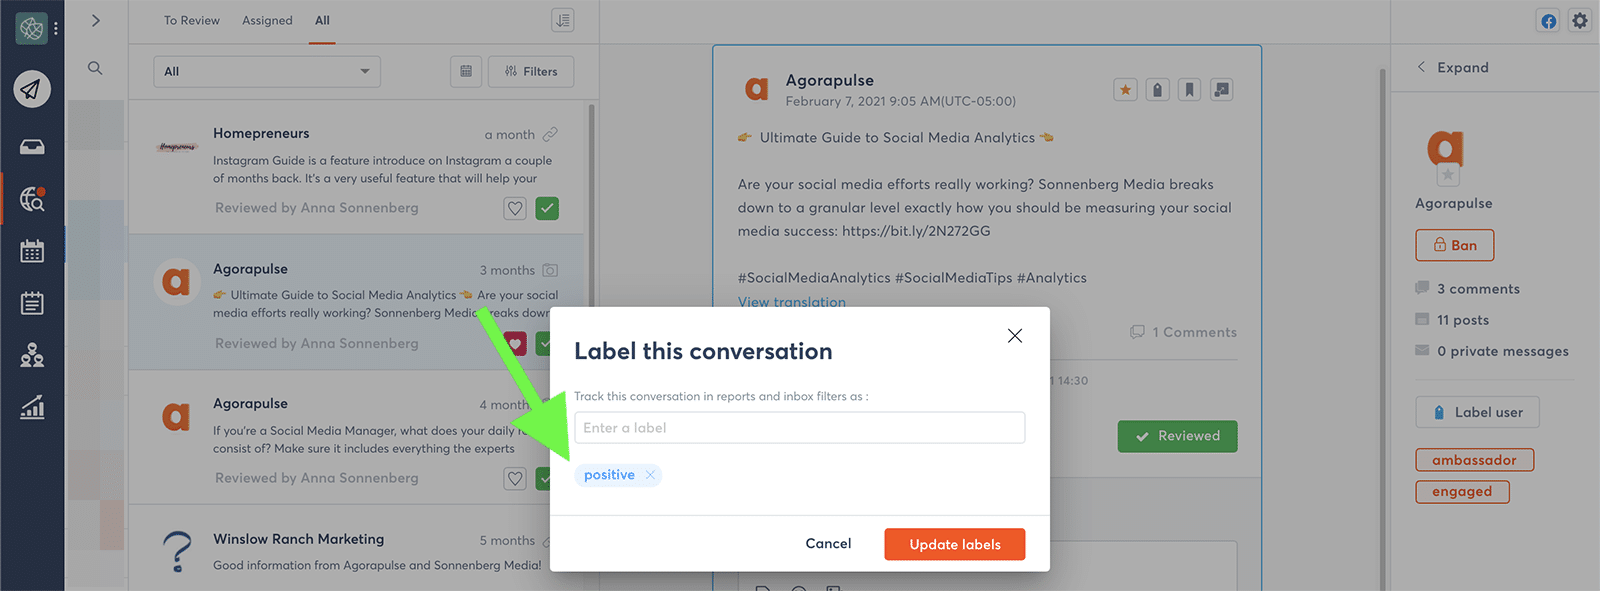
You can monitor sentiment with Agorapulse by labeling the conversations in your inbox. Give every inbox item a positive, negative, neutral, or other custom labels.
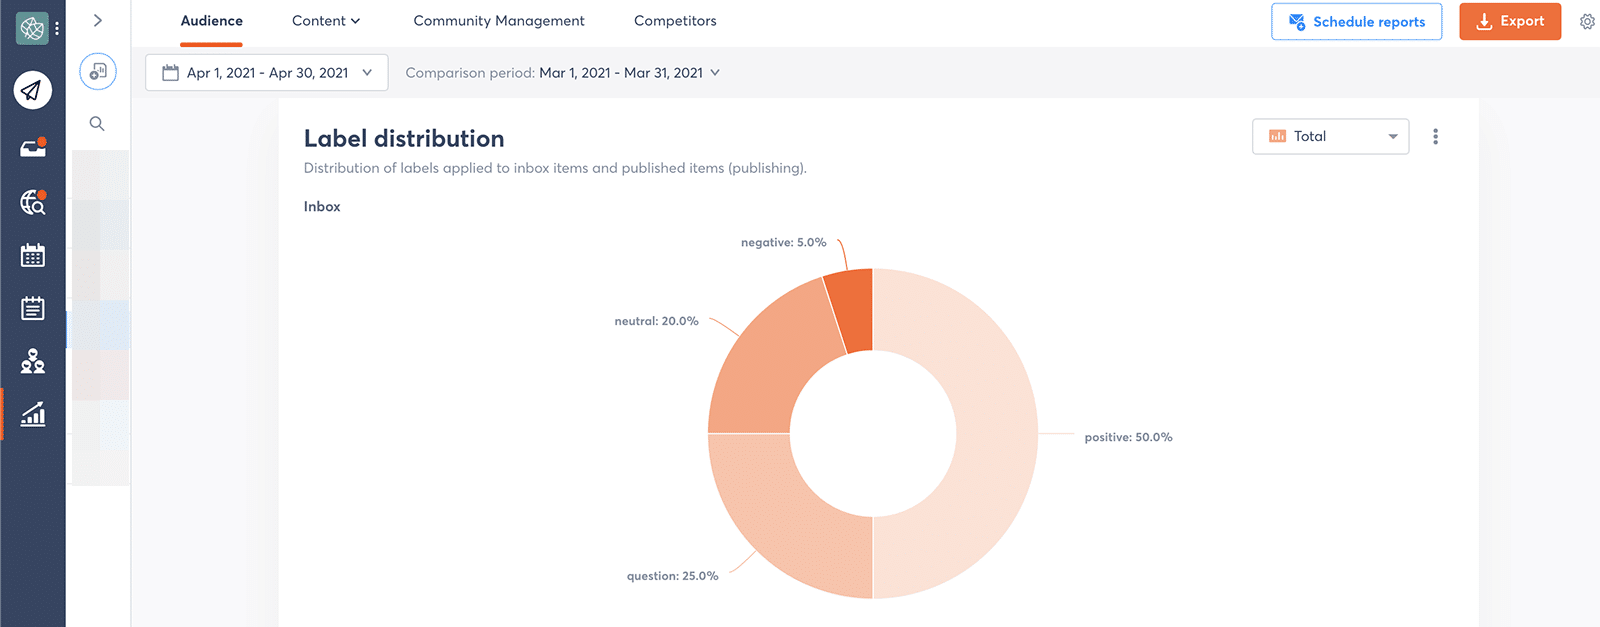
Then go to the label distribution section of your Facebook report. You can see the rate of each sentiment, and you can hover over any section to see the breakdown of posts, comments, and messages.
Facebook Ads Metrics
Does your business run Facebook Ads? You can ensure your campaigns are worth the spend by tracking the most important paid social metrics.
Conversions
Conversions are actions that you want people to take after seeing your ad. A conversion can be anything from making a purchase or submitting a lead form to scheduling an appointment or installing an app.
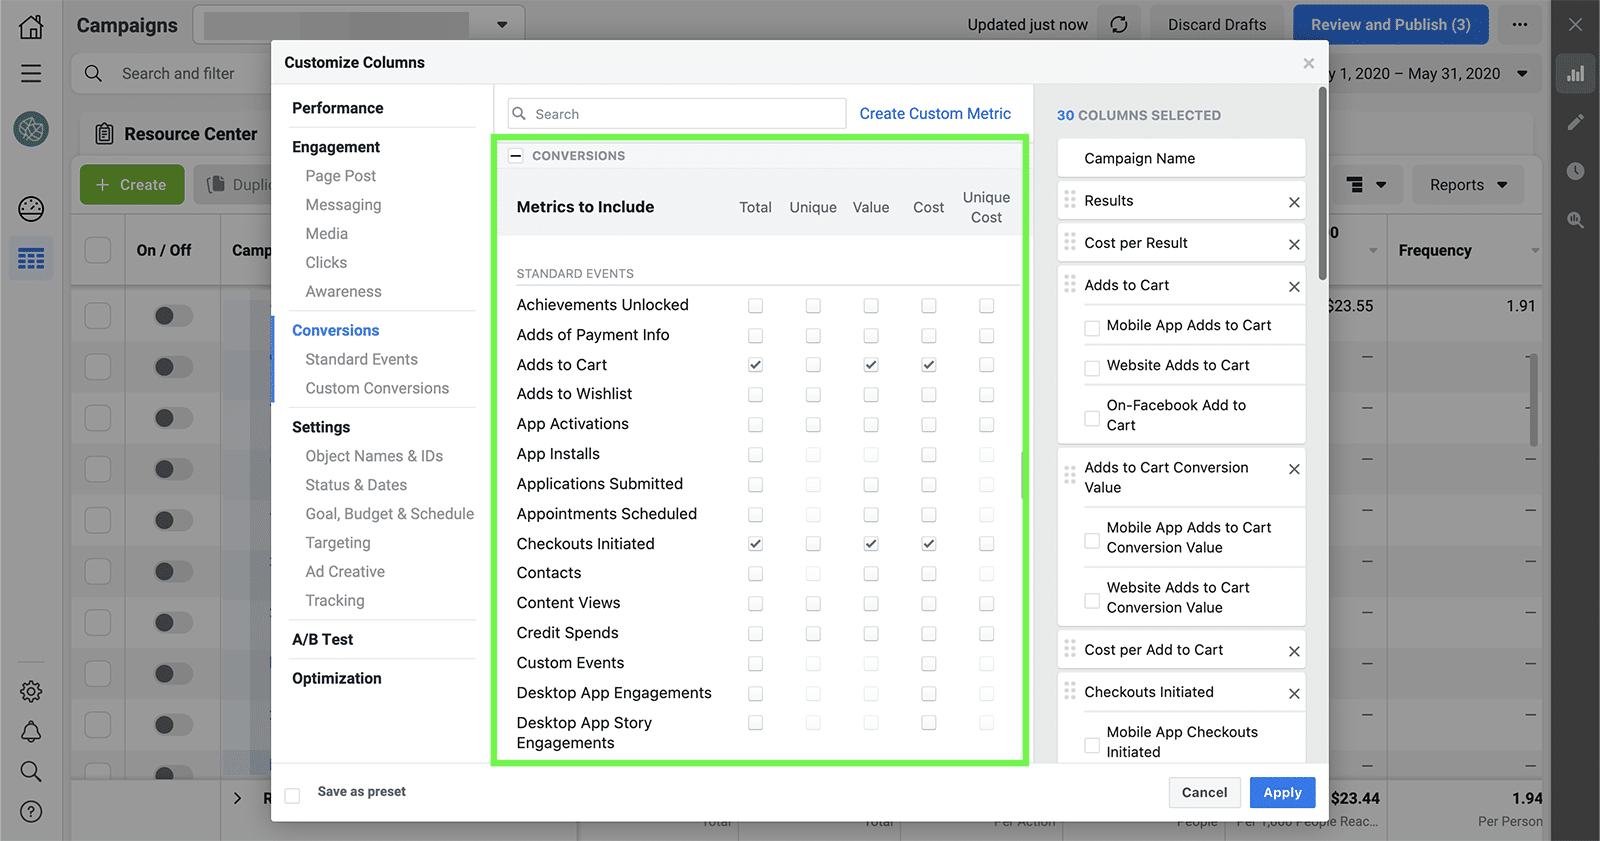
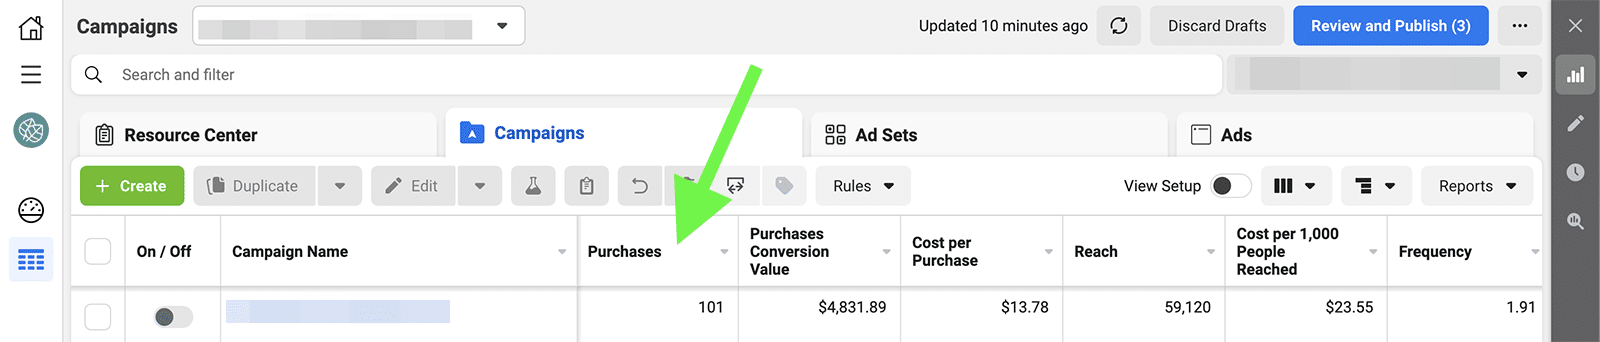
Although you can only optimize your ad set for one type of conversion, you can track as many as you like in your Facebook Ads reporting dashboard. Select the conversions you want to monitor, and then check your dashboard for the results.
Cost per thousand impressions (CPM)
CPM is the amount you spend for every 1,000 impressions of your ad. In addition to monitoring ad impressions, this metric helps you understand what you’re spending for exposure. Ideally, you want this number to be as low as possible so you can reach more people for less.
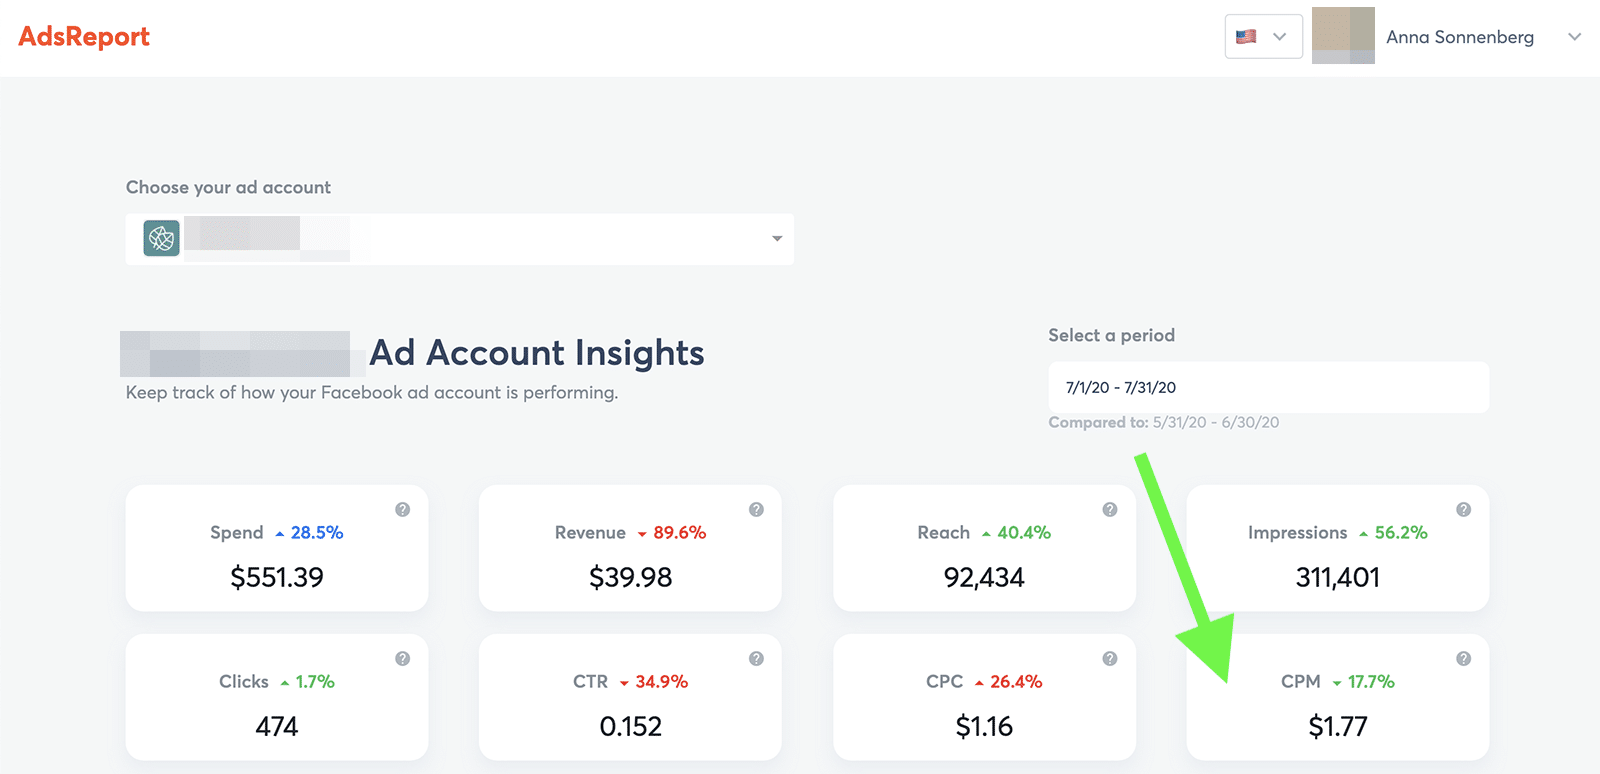
You can monitor CPM in your Facebook Ads dashboard–but there’s an easier way.
With Agorapulse’s Ads Report, you can monitor essential Facebook Ads metrics like CPM in an easy-to-read format. By default, the dashboard displays metrics for all active and paused ads for the time frame you choose. For more targeted results, you can select a single campaign or change the ad status filters.
Cost per click (CPC)
CPC is the amount you spend for each link click from your ad.
If you want to drive as much traffic as possible to your website, this metric is important to monitor. Naturally, the lower your CPC is, the more traffic you can afford to generate given your budget.
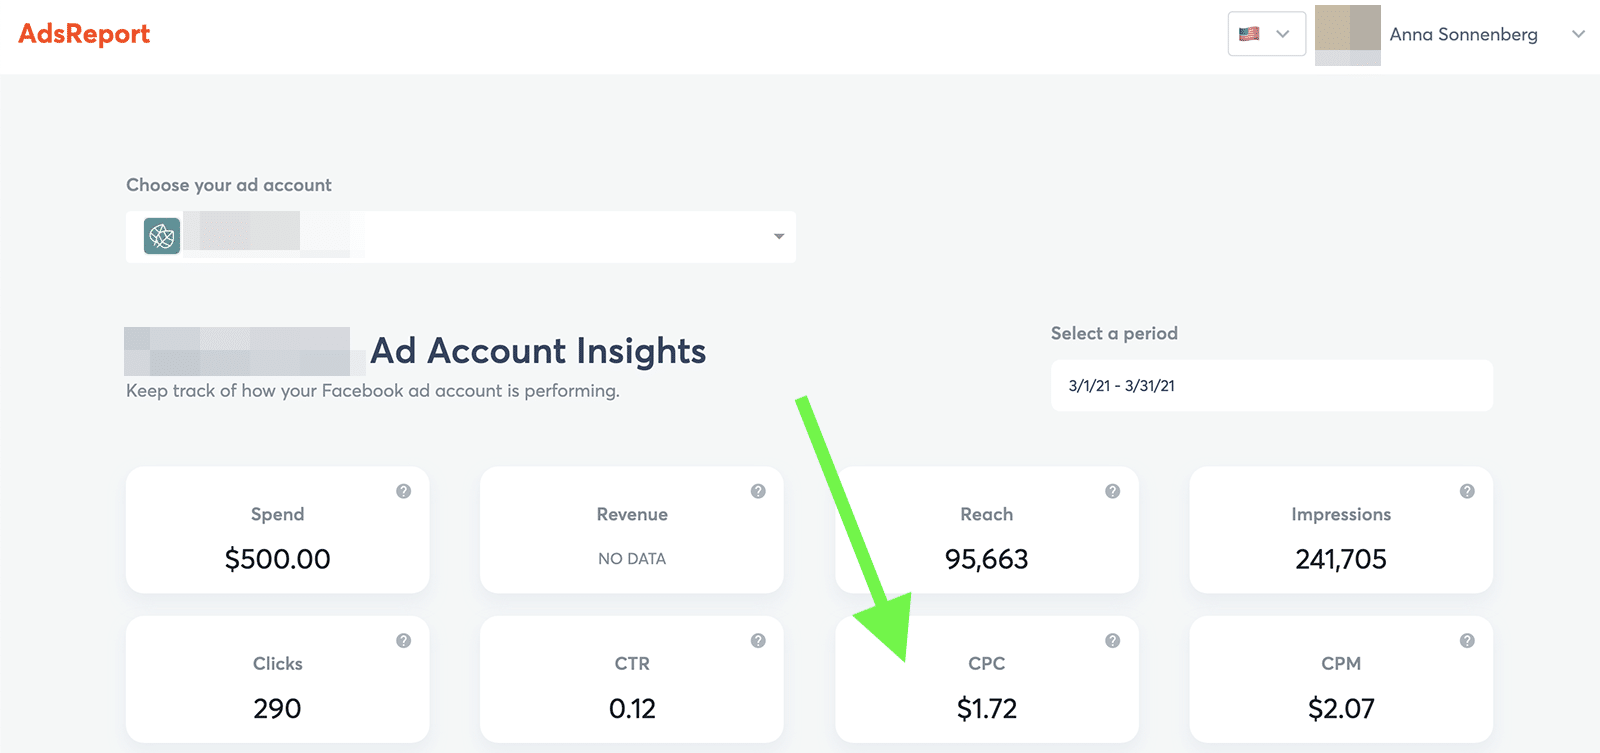
Like CPM, you can monitor CPC in your Agorapulse Ads Report dashboard. Choose the campaign, ad status, and time frame you want to track and check the results.
Click-through rate (CTR)
CTR is the ratio of clicks to impressions for your ad campaigns. Even if your campaign doesn’t specifically target website traffic, it’s a good idea to monitor the CTR for your ad campaigns. A higher CTR indicates that people are interested in what you’re advertising, while an unusually low CTR can tip you off that your ads aren’t hitting the mark.
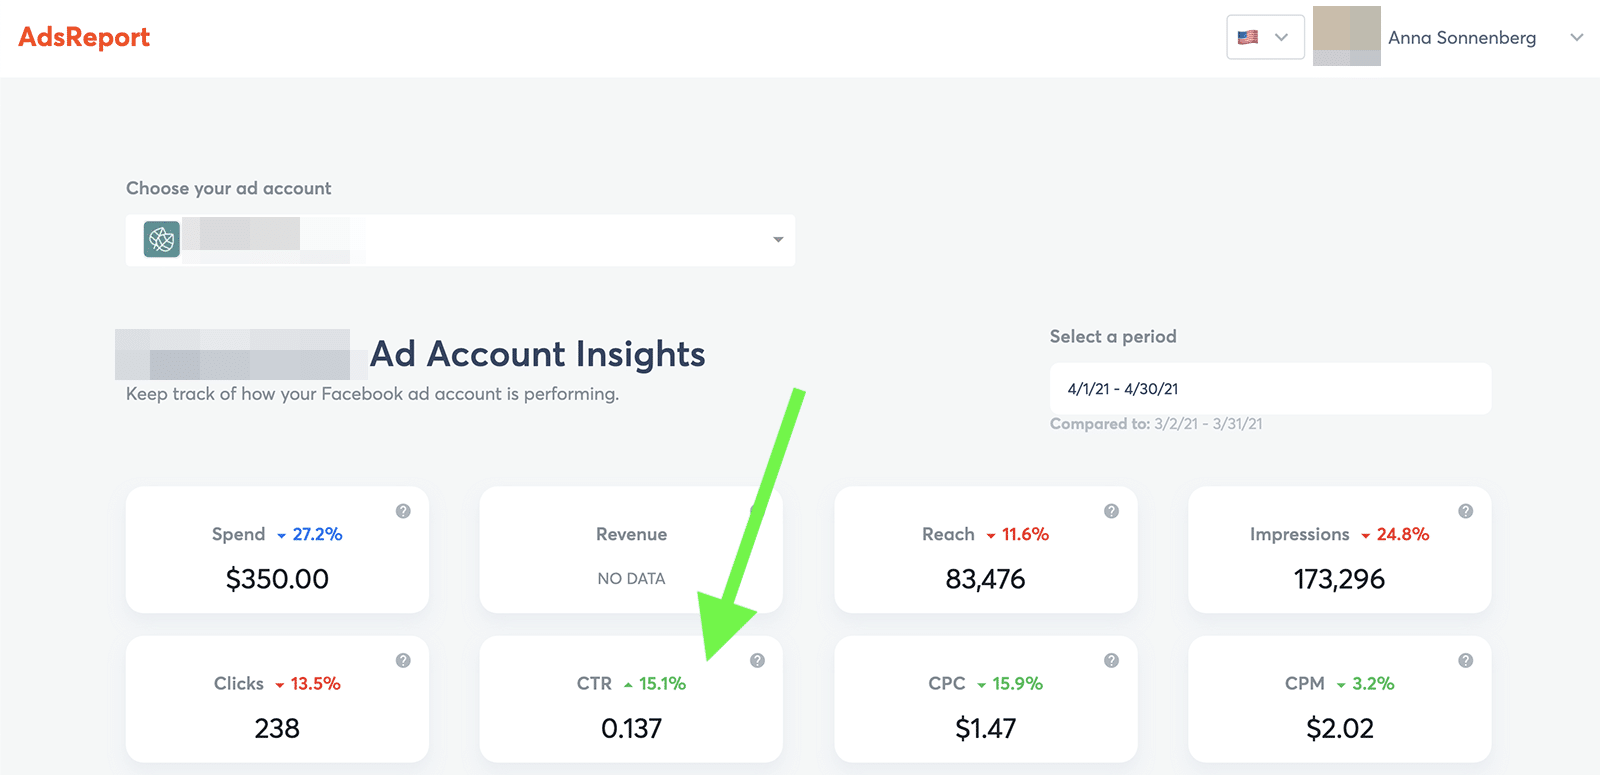
Agorapulse’s Ads Report also tracks CTR so you can monitor this metric easily.
Because this dashboard includes comparative data, you can quickly assess if your CTR has increased, decreased, or remained the same over time. A big decline can alert you to optimization or delivery issues that you should fix, stat.
Facebook Metrics Tips for Agencies
When you need to monitor metrics for multiple agency clients, keeping everything organized can be challenging. So what’s a social media agency team to do?
Use these tips to make analytics and reporting easier for your team and your clients:
Create Power Reports
If you manage multiple social profiles for each client, creating custom Power Reports can save you tons of time. You can add up to five profiles to each report and select only the metrics that matter to your client. When reporting time rolls around, all you have to do is check your Power Report.
Automatically schedule reports
Your team can also save tons of time by scheduling reports in advance. Choose the profiles and metrics you want to feature, and then schedule your reports to arrive weekly or monthly. You can send them to yourself for review or to as many stakeholders as you’d like.
Label inbox items
It’s always a good idea to label inbox items so you can track metrics like customer satisfaction. But when you have dozens of profiles to juggle, it’s more important than ever to automate the process.
Use Agorapulse’s Inbox Assistant to set up rules that label positive and negative engagement automatically. Then check your reports for the results.
In Conclusion
Monitoring Facebook metrics is critical for optimizing your brands’ or your clients’ performance on this channel. Rather than wasting time on empty vanity metrics, use the guidelines above to ensure that your team tracks the metrics that truly matter for your marketing and business objectives.
Take control of your social media right now! Check out our free trial of Agorapulse to help you schedule, track, and measure all your social media efforts.


