

Whether you manage social media for a company or for agency clients, you need to track return on investment (ROI). When you can show the ROI from your work, you can better quantify the value your expertise provides.
Wondering what this metric involves and how to calculate it efficiently? In regards to ROI, analytics is essential.
Here’s how to unlock the ROI of your marketing with analytics. Afterwards, we’ll explore tools that can automate data collection and processing. You can also sign up now for a free trial of Agorapulse and start measuring ROI right away.
What Is ROI for Marketing?
First, let’s establish a simple ROI definition. In marketing, ROI is a way to measure the profitability of a campaign.
How to calculate ROI
A basic ROI calculation can tell you how much your marketing efforts have generated compared to what you spent on the campaign:
(Sales Growth – Marketing Cost) / Marketing Cost) x 100% = ROI
Curious how this formula would apply to a paid campaign?
Let’s say you ran Facebook ads and spent a total campaign budget of $500. Say the total revenue from the campaign was $5,000. In this example, your ROI would look like this:
(($5,000 – $500) / $500) x 100% = 900%
If that sounds like a pretty great ROI, you’re right. A 900% return from a single ad campaign is impressive.
But a good ROI depends a lot on benchmarks and what you’ve accomplished through past efforts. A good marketing ROI also depends on your industry, platforms, and strategies you use to generate leads, sales, and conversions.
Why You Should Track Marketing ROI
Wondering why calculating and monitoring ROI is so important? Let’s look at a few reasons you should take time to track and report on ROI.
Measure success
The basic ROI calculation above can provide a positive or negative result. The latter indicates that the marketing campaign is losing money, but a positive result confirms that your efforts are generating a profit.
With an ROI analysis, you can confirm whether your campaign has been successful. You can also measure the efficacy of your efforts and set benchmarks for future campaigns.
Find what works
With the right data, you can break down ROI to a granular level. For example, you can determine which channels drive the biggest return. You can also figure out which offer or ad type generates the largest profit.
Using these insights, you can design more effective campaigns. After all, you’ll already have an idea of the channel, offer type, messaging, and other factors that get the ROI you want.
Make improvements
When you track ROI, you never have to guess whether your efforts are worthwhile. With this metric, you can easily identify when a campaign or channel isn’t working.
Then you can make adjustments to improve the offer, messaging, landing page, or other elements. Since you can compare current ROI to established benchmarks, you can easily find whether your updates have been successful—or if you need additional optimization.
Allocate budgets
By tracking ROI, you can make more informed decisions about how to allocate marketing budgets. That means you don’t have to guess how to divide your budget or choose an arbitrary breakdown.
Instead, you can assign your budget to the channels most likely to generate the return you want. For example, if you know Facebook ads usually generates a higher ROI than Google ads, you can invest the right amount in each channel.

Why You Need Analytics to Calculate Social ROI
The basic ROI calculation above is simple. But getting accurate numbers to plug into the equation is a little more complex. And running calculations for every single social media campaign can become incredibly time-consuming.
Analytics automates the process of calculating ROI. That makes it much easier to get the information you need, so you can run marketing campaigns successfully.
With marketing and social media analytics, you can track and process data from virtually any channel. That means you can find patterns, identify relationships, and anticipate outcomes.
No matter what marketing channels you’re using, results and costs can evolve quickly. With analytics, you can also process data for almost any time frame, using your findings to model future returns.
As a result, you can make business decisions more easily—using data to drive your strategy and optimize your return.
6 Tools to Track ROI Analytics
At Agorapulse, we’re often asked, “What kind of analytics tools have you used for measuring social media ROI?” Because so many different channels can drive revenue and provide value for your marketing campaigns, you have tons of good options to consider.
Let’s look at six of the top tools for ROI analytics.
1. Google Analytics
If you’re looking for a free analytics tool that measures marketing ROI, Google Analytics is a great choice. It can easily track link clicks and user activity throughout your website so you can determine traffic sources and outcomes.
With some basic setup, Google Analytics can track conversions and custom goal paths on your website. This free tool also has the capacity to monitor e-commerce conversions and revenue so you can calculate the exact value of your efforts.
Because it seamlessly integrates with other Google tools, you can connect Google Analytics with Google Ads, too. That means it can help you monitor ROI from pay-per-click (PPC) campaigns.
But what about your paid and organic social media campaigns?
Google Analytics can monitor social media ROI, too. By adding UTM parameters to your social media links and importing data from your social campaigns, you can use Google Analytics as a comprehensive ROI analytics tool.
We’ll cover the complete process for setting up Google Analytics below. Jump down to see the step-by-step process for using this free tool to measure marketing ROI.
2. Agorapulse
When tracking social media ROI is your main priority, Agorapulse offers a streamlined solution. This social media tool has a built-in ROI tracker designed for Facebook and automatically calculates the return from your page’s organic Facebook activity.
To find your Facebook ROI in Agorapulse, go to Reports and select your business page. Scroll to the bottom of the Audience tab to view your ROI.
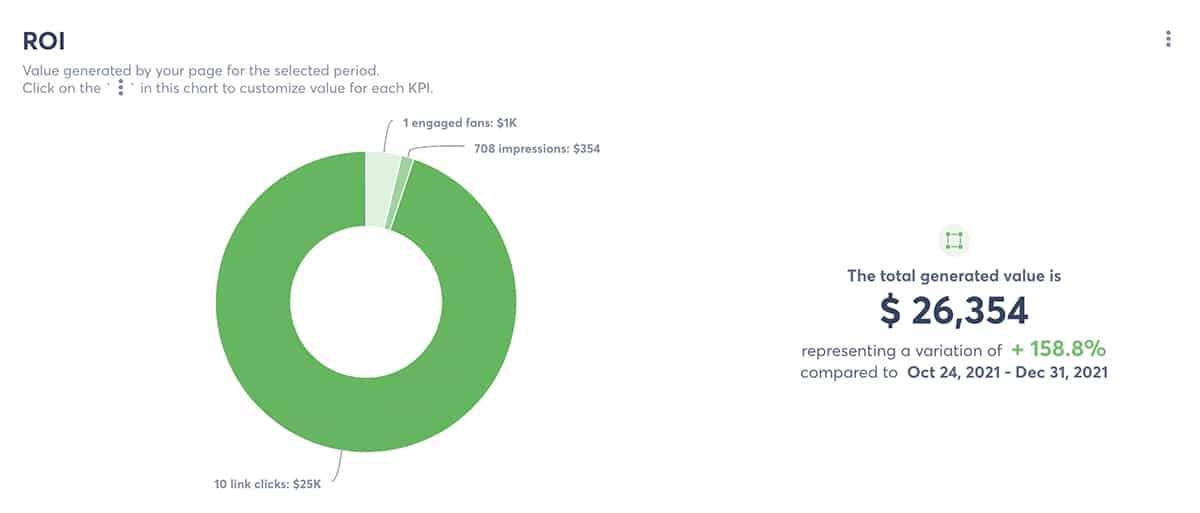
Because Agorapulse tracks organic ROI rather than the return from paid campaigns, the formula works a little differently.
Agorapulse determines Facebook ROI based on three metrics, using default values for each:
- Engaged fans ($1)
- Impressions ($5)
- Link clicks ($1)
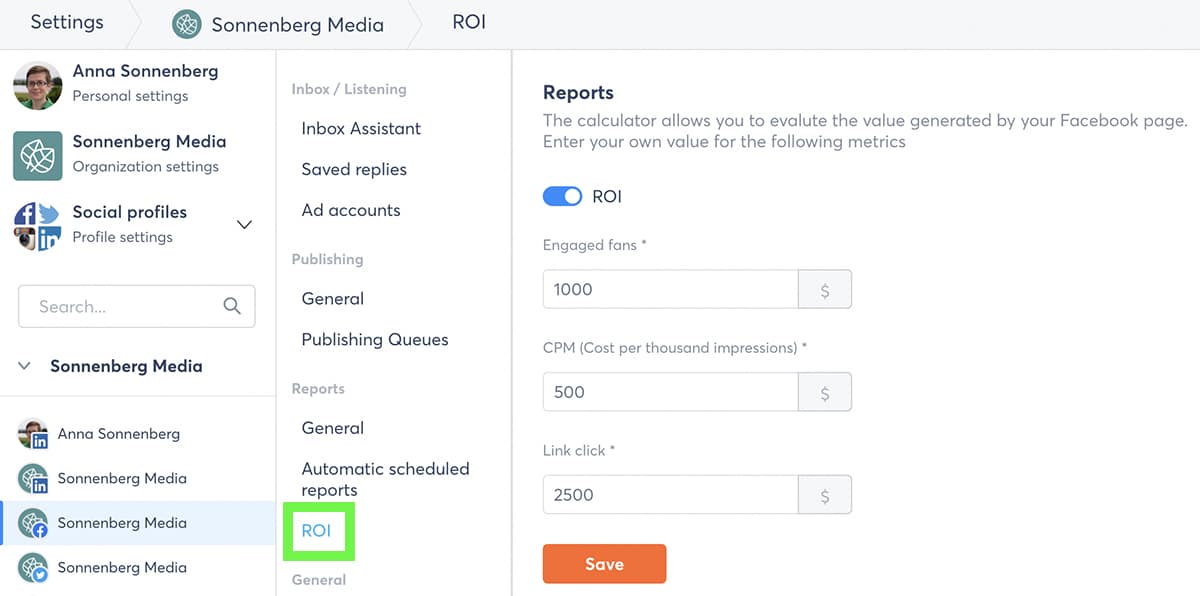
You can use these default values or input your own custom amount for each. Use your organization’s data and key performance indicators (KPIs) to customize the metrics and values that matter most to your organization.
To adjust the values, tap the three dots in the upper right corner and select Manage ROI. Then input the value for each metric and click the Save button.
You can also adjust the time frame for your report, so you can view organic Facebook ROI for any period.
Agorapulse automatically compares your ROI to the previous period (or any other time frame you set) so you can see whether this metric is trending upward or downward.
3. Cyfe
As a customizable dashboard tool, Cyfe can monitor ROI and other important metrics from virtually any channel. This tool is designed to collect and process analytics from social media, website, PPC, and a range of other marketing and advertising channels.
You can use its standard business dashboards to visualize analytics and monitor ROI across marketing campaigns. You can also create customized dashboards and widgets to connect all your organization’s analytics.
With Cyfe, you can benchmark your organization’s performance over time and across campaigns. That way, you can identify the activities and efforts that contribute the highest ROI—and use your insights to design campaigns that continue to provide value.
This analytics tool also offers goal tracking to keep your team on target. That way you can ensure you’re making progress toward key business objectives.
4. Heap
As a high-powered website analytics tool, Heap is designed to monitor the ROI from your marketing funnels. Do you want to know which marketing channel generates the greatest value? You can build separate funnels and use Heap’s dashboards to track results.
With Heap, you can track any user path through your website. Using these custom journey maps, you can identify the most successful funnels and pinpoint areas of friction. You can also understand the value each step provides, which can help you build better funnels.
Heap also makes it easy to segment users for more detailed analyses. Using these insights, you can determine which user groups drive the highest ROI—allowing you to maximize return and make more lucrative decisions for your business.
5. Mixpanel
Another funnel analytics tool, Mixpanel is designed to evaluate your marketing and conversion funnels. This low-code solution lets you analyze user flows and monitor conversion rates so you know how much value your efforts are driving at any time.
In addition to funnel reports, Mixpanel also provides retention reports that help you visualize the types of users who become loyal customers. Using insights from Mixpanel, you can identify where users tend to drop off—so you can improve conversions and increase ROI.
With Mixpanel, you can also pinpoint trends and dramatic changes from your typical benchmarks. That way, you can understand which campaigns or marketing efforts are driving conversions so you can leverage them more effectively.
6. Whatagraph
If your team runs cross-channel marketing campaigns, Whatagraph can help you analyze results efficiently. You can use the tool’s pre-made templates to assess performance and share reports with teammates and clients seamlessly.
You can also create customizable dashboards to monitor the marketing channels that matter—from social media to PPC to organic search. Whatagraph offers more than 40 integrations and lets you connect custom data via tools like Google Sheets and a public API.
Since you can combine multiple channels in a single dashboard, there’s no need to jump from screen to screen. Instead, you can quickly assess your cross-channel campaign spending, conversion rates, ROI, and other key metrics.
How to Set up Google Analytics to Measure ROI
Google Analytics may not have the custom widgets and dashboards that a lot of subscription-based analytics tools provide. But when you want to start measuring marketing ROI for free, Google Analytics is a great place to begin.
First, install Google Analytics on your website. Then follow the steps below to track ROI.
Set up goals and conversions
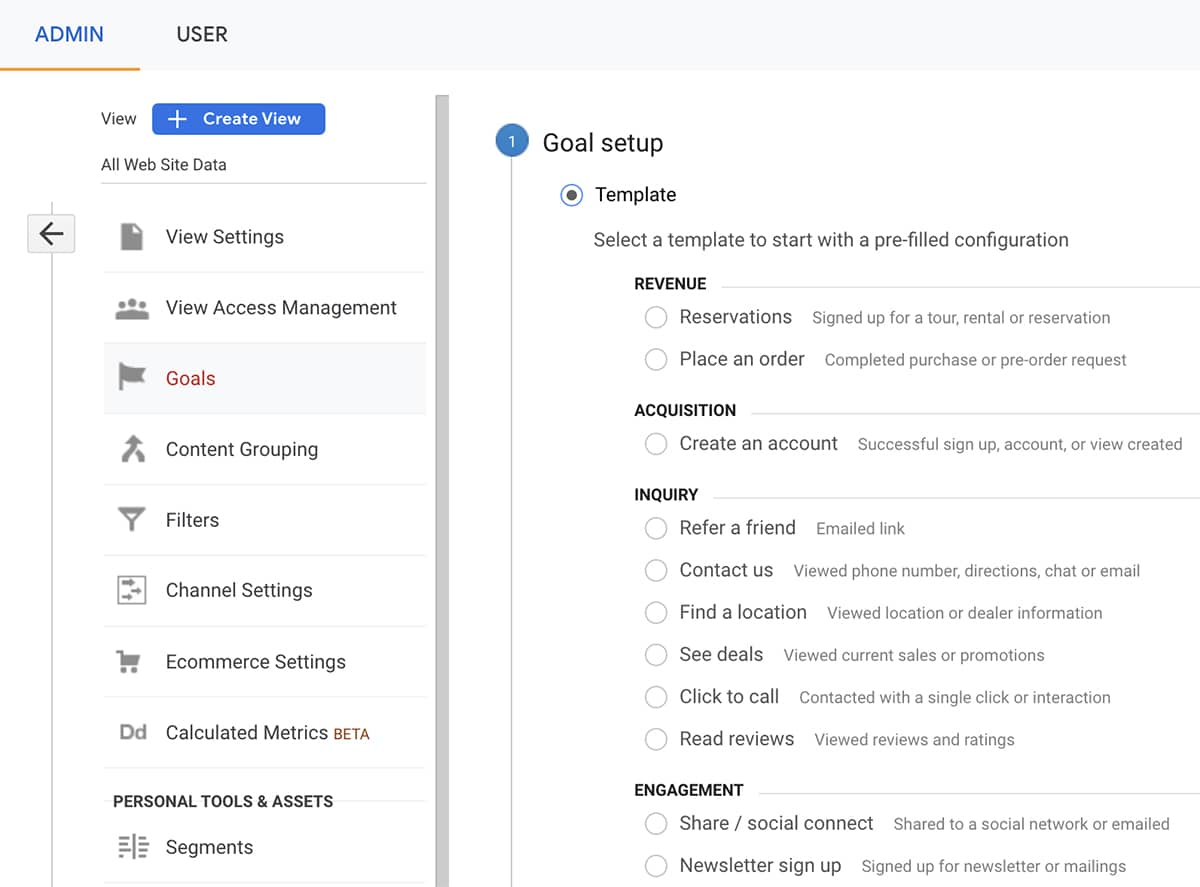
No matter what marketing channels your team typically uses, goals and conversions can help you measure the results that matter. Click the gear icon in the lower left corner of Google Analytics and select Goals from the View column.
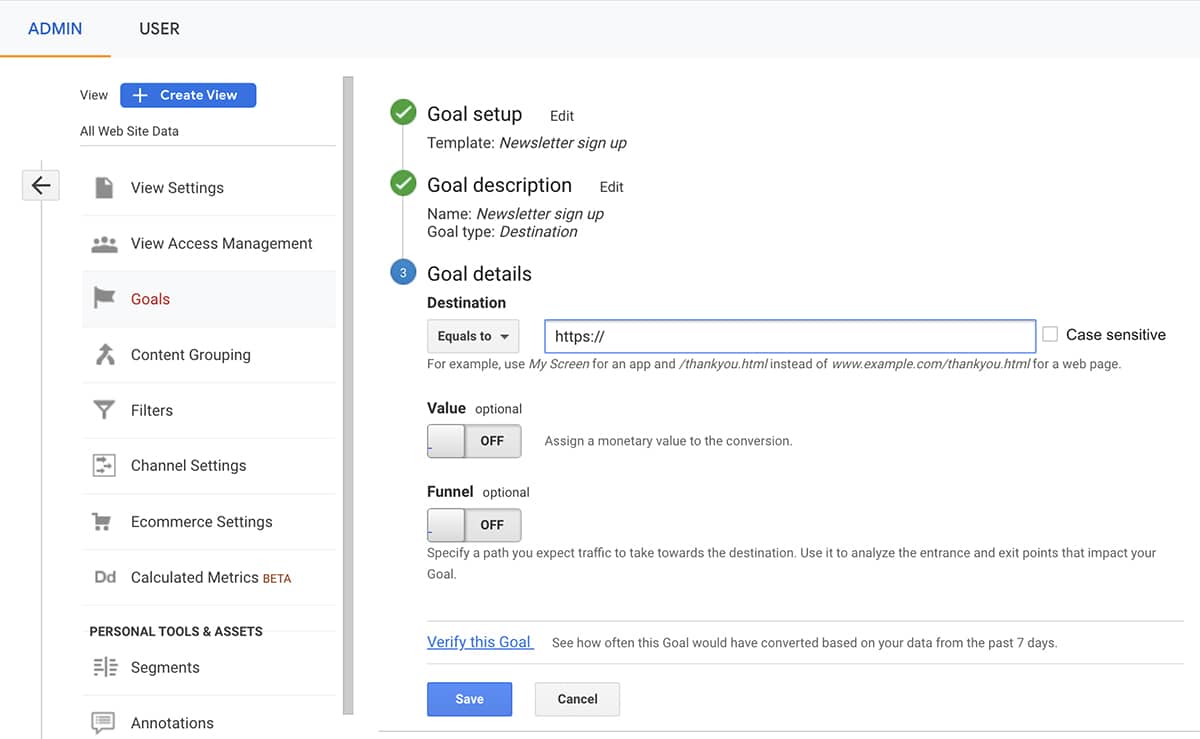
Click the New Goal button and choose from the list of templates. You can track anything from completed purchases to account creation to newsletter signups.
Then give the goal a title and choose a type. If the conversion happens when a user reaches a specific page on your website—such as a thank-you page—select Destination. On the next screen, paste the URL and enter an optional value. You can also add the step to a funnel.
Go back to the Google Analytics admin panel and select Ecommerce Settings from the View column. Switch on the Enable Ecommerce and Enable Enhanced Ecommerce Reporting options.
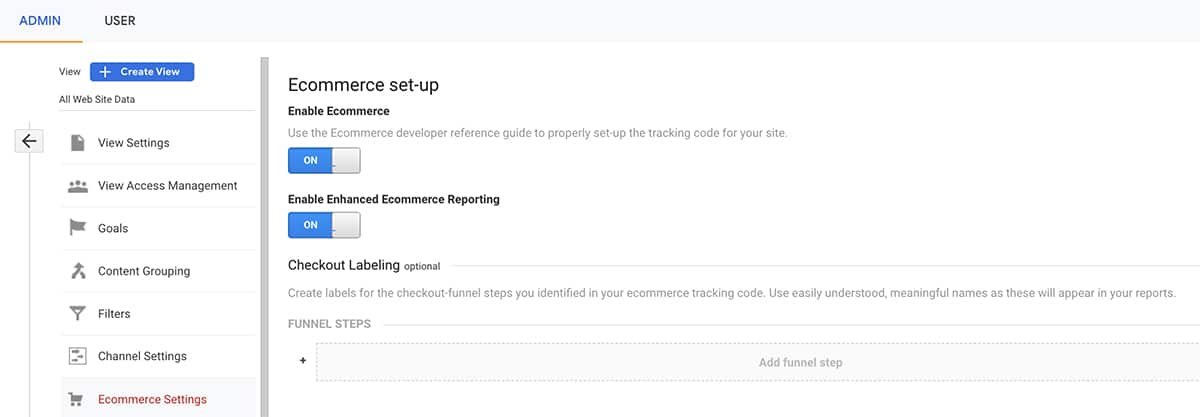
Now you can track conversions and eCommerce revenue with Google Analytics—and you can easily identify ROI for any channel. To view these metrics, open the Acquisition dropdown and check the Overview tab. To find top-performing channels, sort by revenue, transactions, or conversions.
Note that Google Analytics doesn’t provide ROI by default. (See below for a workaround.) But you can easily calculate ROI using the formula we discussed above.
Link Google Ads to Google Analytics
Do you want to know how to use analytics conversions to increase ROI on PPC campaigns? Connecting your Google Ads account to Google Analytics is easy. In Google Analytics, click the gear icon in the lower left corner of the screen.
In the Property column, select Google Ads Links. On the next screen, check the box next to the Google Ads account you want to link and click the blue Continue button.
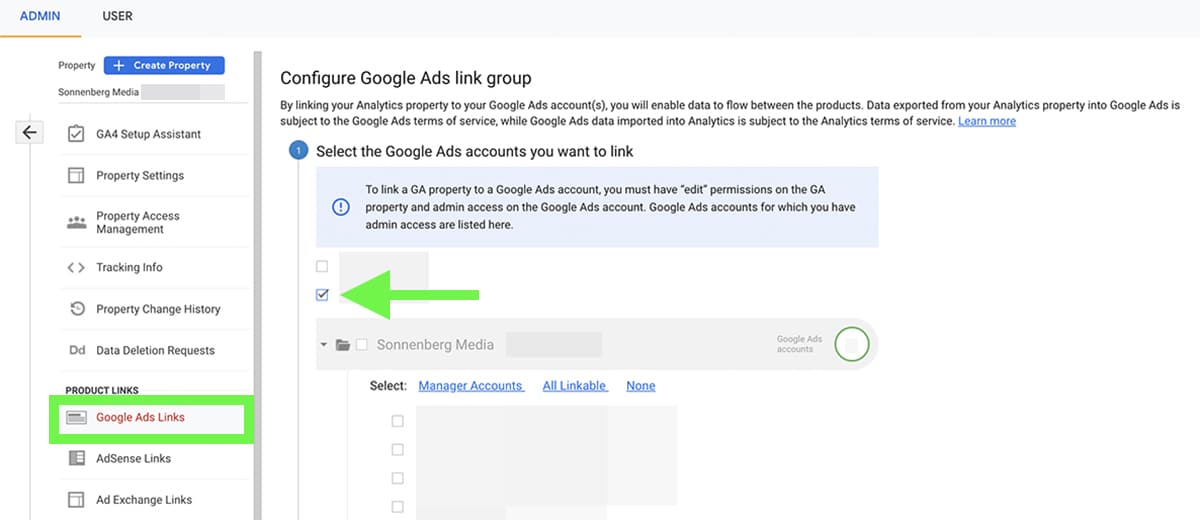
Give the link group a title, and toggle on any views you want to link. Then click the Link Accounts button to complete the process.
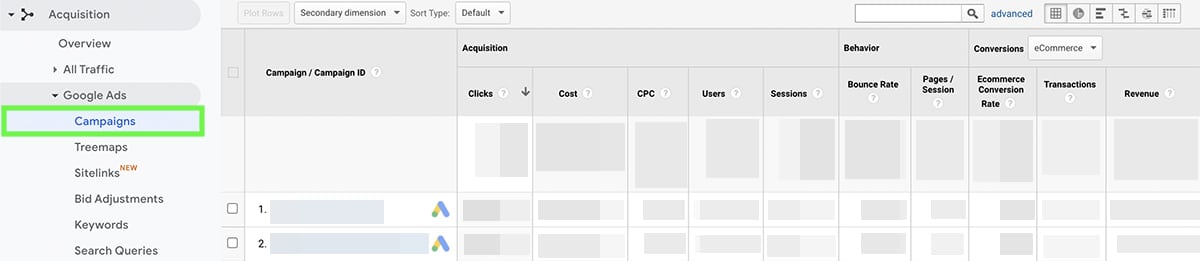
Now, you can view the results of Google Ads campaigns in Google Analytics. Open the Acquisition dropdown menu and select Google Ads. Then click through to view the cost, revenue, and conversion rate from your campaigns and ad groups.
Although Google Analytics doesn’t automatically display the ROI from your PPC campaigns, you can calculate it easily. Plug the cost and the revenue from any campaign into the formula above to get your ROI.
Use and track UTM parameters
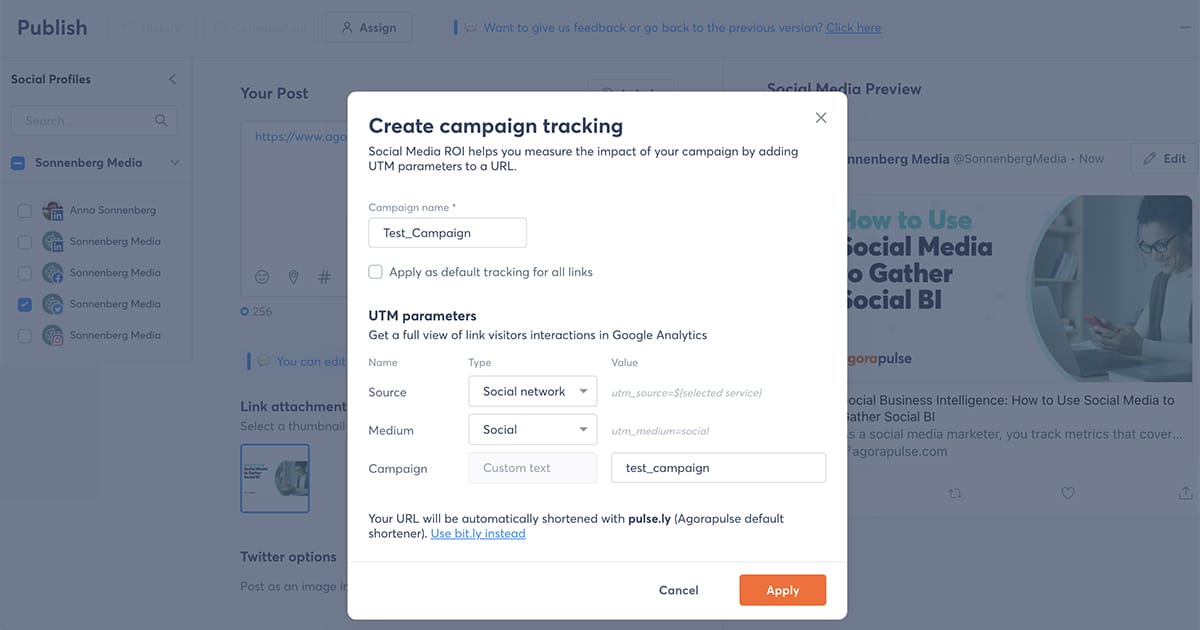
Do you want to track ROI from organic social media campaigns? First, add UTM tracking codes when you publish social media content.
You can easily add these parameters in Agorapulse.
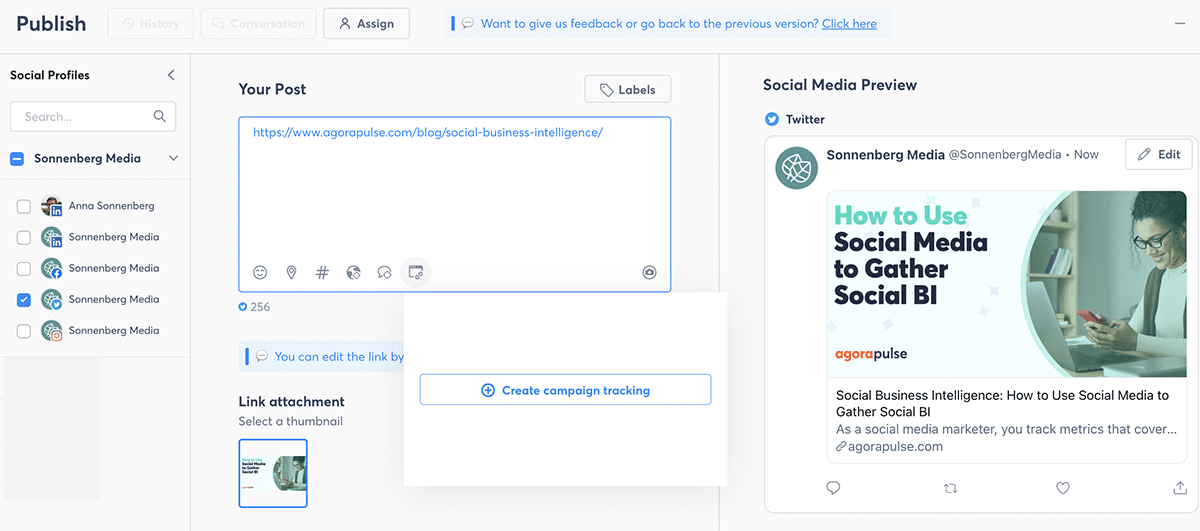
Open the Publishing Composer and create a new social media post. Then click the Create Campaign Tracking button. Agorapulse automatically configures the Source and Medium parameters. Under Campaign, input a name and click the Apply button.
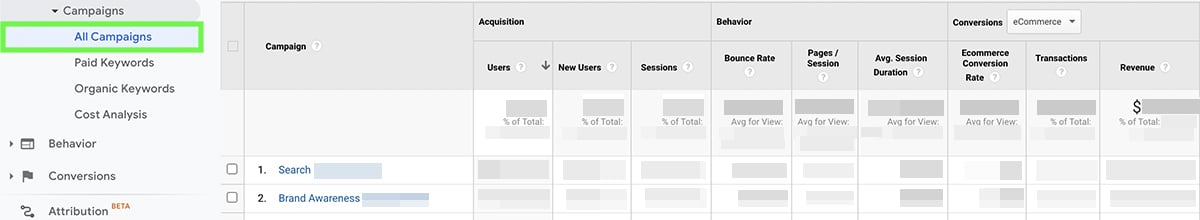
Once the post goes live and drives traffic to your website, you can view the results in Google Analytics. Open the Acquisition dropdown menu and select Campaigns. Then scroll to view results from the campaign you want to track.
Import marketing data in Google Analytics
Although Google Analytics can track the cost of your Google Ads campaigns, it doesn’t track what you spend on other marketing channels. Fortunately, you can use a workaround to import the data and access ROI metrics.
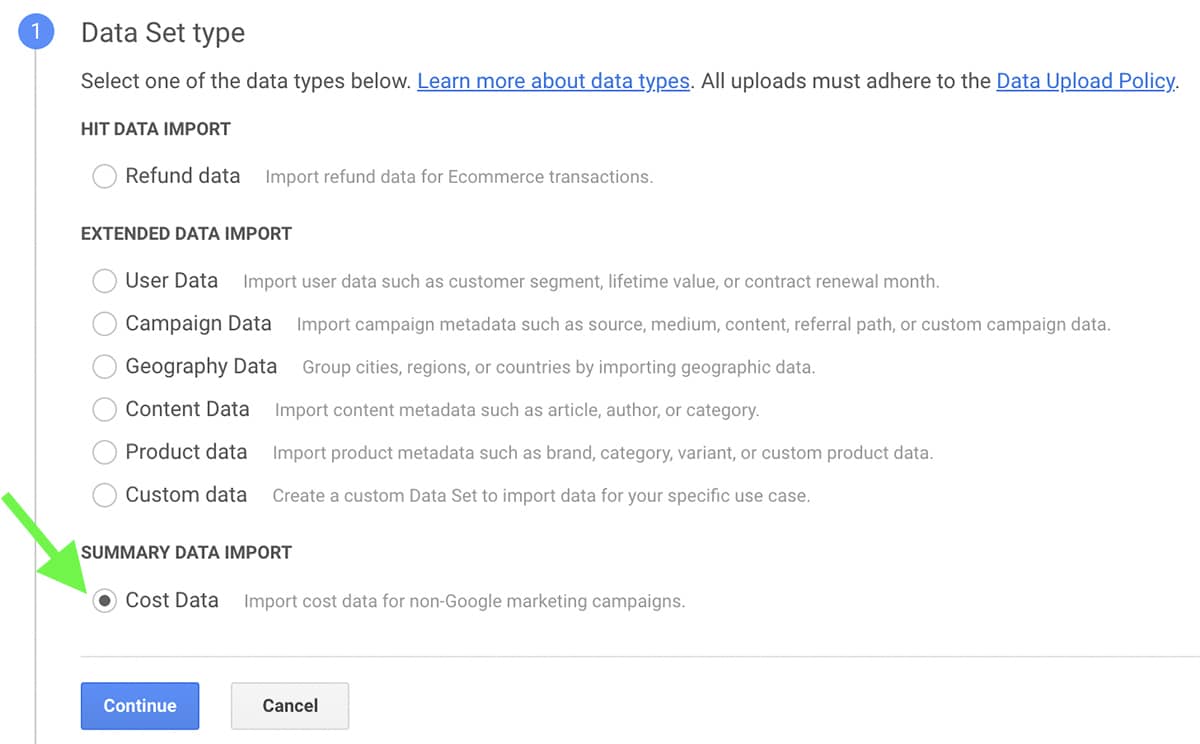
Click the gear icon to open the Admin panel. Scroll to the bottom of the Property column and click Data Import. Then click the Create button. For the Data Set Type, select Cost Data. Give the data set a name and enable at least one view.
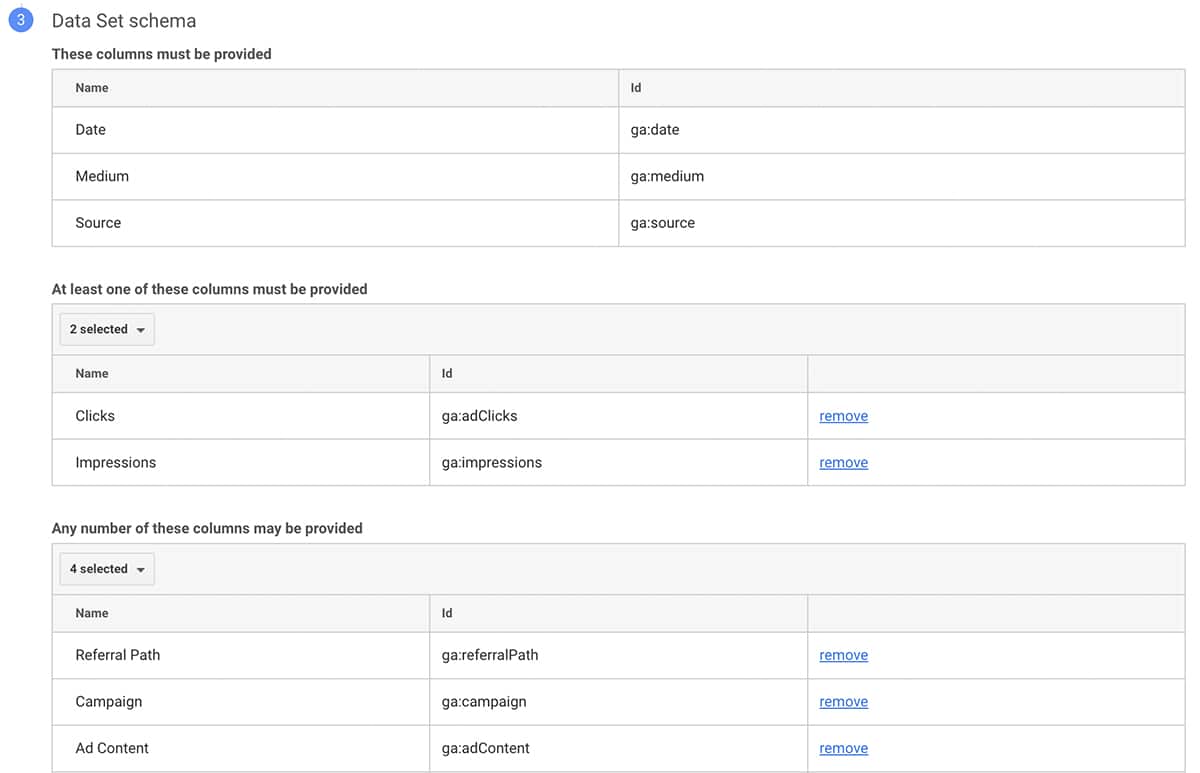
Then configure your Data Set Schema by selecting the types of information you plan to upload. Return to the Data Import screen and click the Manage Uploads link. Then click Upload File and provide cost data using the schema you configured.
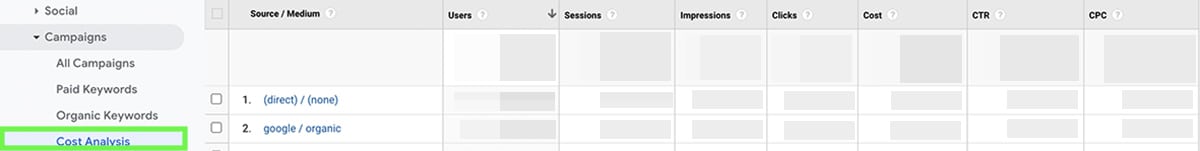
Now you can compare cost and ROI across channels and campaigns. Open the Acquisition dropdown menu and select Campaigns. Click Cost Analysis to see how your marketing channels measure up—and use the insights to maximize ROI from future campaigns.
What We Learned About Marketing ROI Analytics
Monitoring marketing ROI is essential for determining the success of your paid and organic campaigns. But whether you’re tracking one or multiple channels, calculating your return accurately can be challenging.
That’s why when digging for ROI, analytics tools are key.
With the right analytics solution, you can gather and process data from all relevant marketing channels—so you can always use ROI to optimize campaigns and guide decisions. Sign up for a free demo to learn how you can start measuring your social ROI right now.


