As a social media manager, you know the importance of monitoring campaign performance and provide reporting for your team. But are you paying attention to the right metrics–or are you neglecting crucial data?
Let’s look at how to track the social media metrics that matter and learn why it’s critical to focus on the right measurements.
What Are Social Media Metrics?
Social media metrics are measurements that marketers use to gauge a brand’s performance on various social channels. Metrics typically refer to a category of data, such as likes or sentiment.
Although social media marketing metrics are similar to key performance indicators (KPIs), there’s a significant difference. Social KPIs are goals that refer to a specific measurement, such as 100 likes or 50% positive sentiment.
Why Should You Track Social Media Metrics?
The metrics that matter to your brand depend on the channels you use and the goals you’ve set.
When you report on key social metrics, you get the following benefits.
Tracking progress toward goals
Are your social channels driving the engagement or the clicks your marketing team wants to see? A social media metrics report quantifies what your efforts have achieved and pinpoints where you’ve succeeded.
Improving social media performance
A social media report can also help your team identify areas that need improvement. By tracking the right metrics, you can continuously optimize your results.
Understanding the value of your work
Do stakeholders want your team to quantify the value that your efforts generate? With a social metrics report, you can easily calculate the return on investment (ROI) from your team’s work.
What You Should Know About the Social Media Funnel
A social media funnel refers to the journey that customers take as they get to know your brand, learn about your products and/or services, and eventually make a purchase.
When you have a clear understanding of how your company’s social media funnel works, you know what type of content to post to guide followers from one stage to the next.
Do you have a social media content strategy?
Knowing how your brand’s funnel works can also help your team set relevant social media goals and track the right metrics.
Phases of a typical social media funnel
- Awareness. Located at the top of the funnel, the awareness stage is for people learning about your brand for the first time. Awareness metrics often include brand awareness, reach, and share of voice.
- Engagement. Positioned at the middle of the funnel, the engagement or consideration stage is for people researching solutions to a problem and keeping your brand top of mind. Engagement metrics include likes, shares, comments, clicks, and virality.
- Conversion. Located near the bottom of the funnel, the conversion stage is for people who have decided to make a purchase. Conversion metrics can include conversions, conversion rate, purchases, and ROI.
- Advocacy. Generally located at the very bottom of the funnel, the advocacy stage is for loyal customers. Advocacy metrics include the number of ambassadors and testimonials.
Awareness Metrics
This data highlights how well your brand reaches and connects with potential customers.
Quick overview of awareness metrics
- Brand awareness
- Post reach
- Potential reach
- Impressions
- Audience growth
- Social share of voice
- Customer sentiment
Let’s look at each of those more closely.
Brand awareness
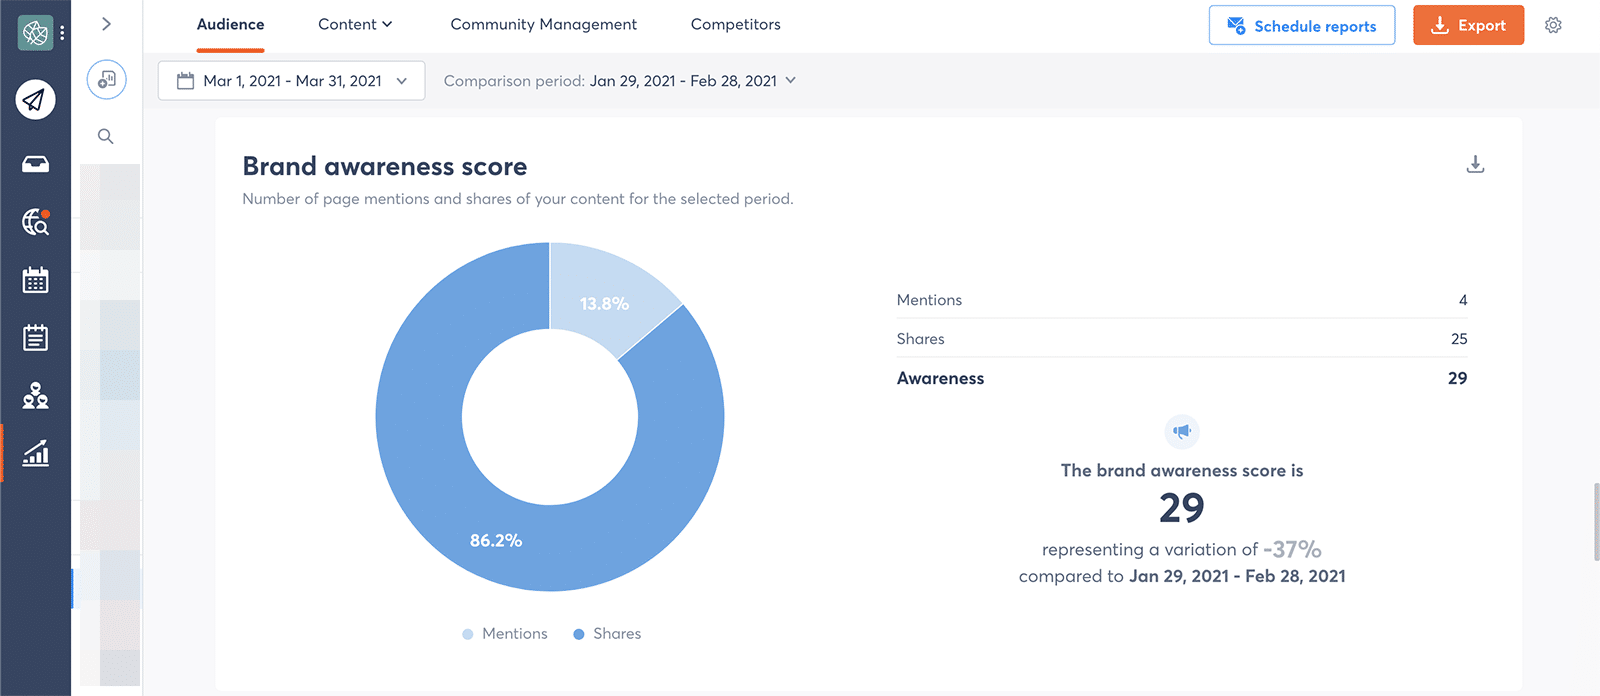
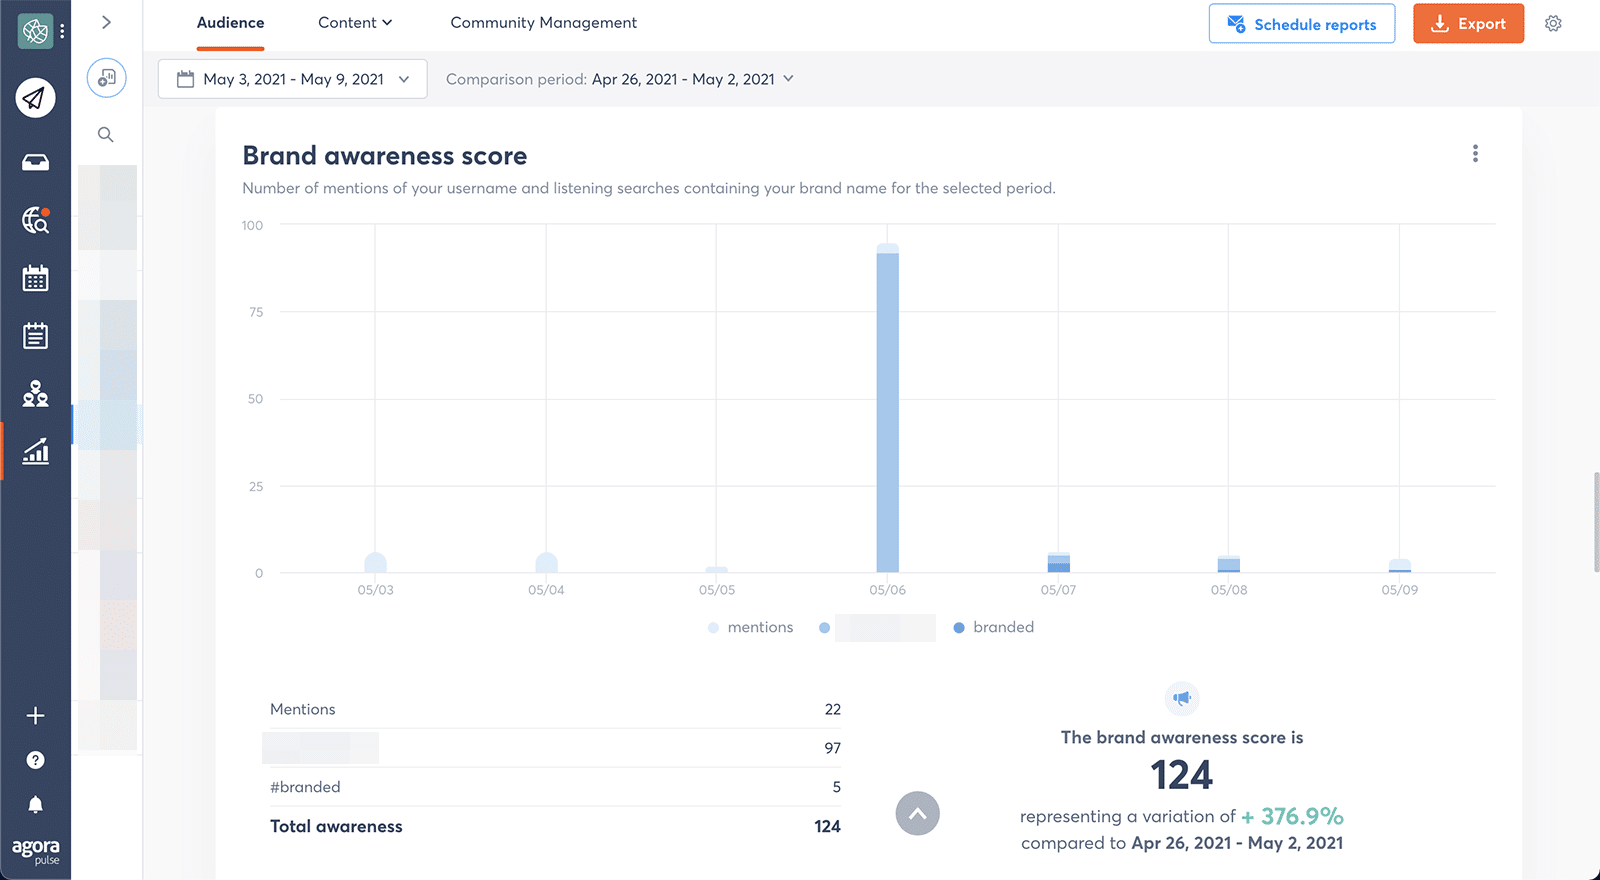
Brand awareness measures how much people are talking about your brand on social media.
Each social channel quantifies brand awareness a little differently based on the type of data available. Depending on the channel you’re tracking, your brand awareness score might factor in mentions, shares, or branded hashtags.
If you use native tools or other free social media metrics dashboards, you might have to track each of these data points separately and calculate the total yourself.
However, Agorapulse’s social media metrics dashboard tracks brand awareness automatically.
Go to the Audience tab to access your brand awareness chart.
Post Reach
Post reach reflects the number of social media users your content reached. This metric can help your team understand how many customers you’ve connected with and the number of people who know about your business. You can find this metric in Agorapulse’s content report.
Choose from:
Potential reach
Potential reach is the number of users who could possibly see your content.
To track this metric, you’ll need to do some manual calculations:
- First, check your brand mentions and click on each account that mentioned you.
- Make note of how many followers each account has.
- Add them up and multiply the number by 2% to 5% (average organic reach) to get your potential reach.
Impressions
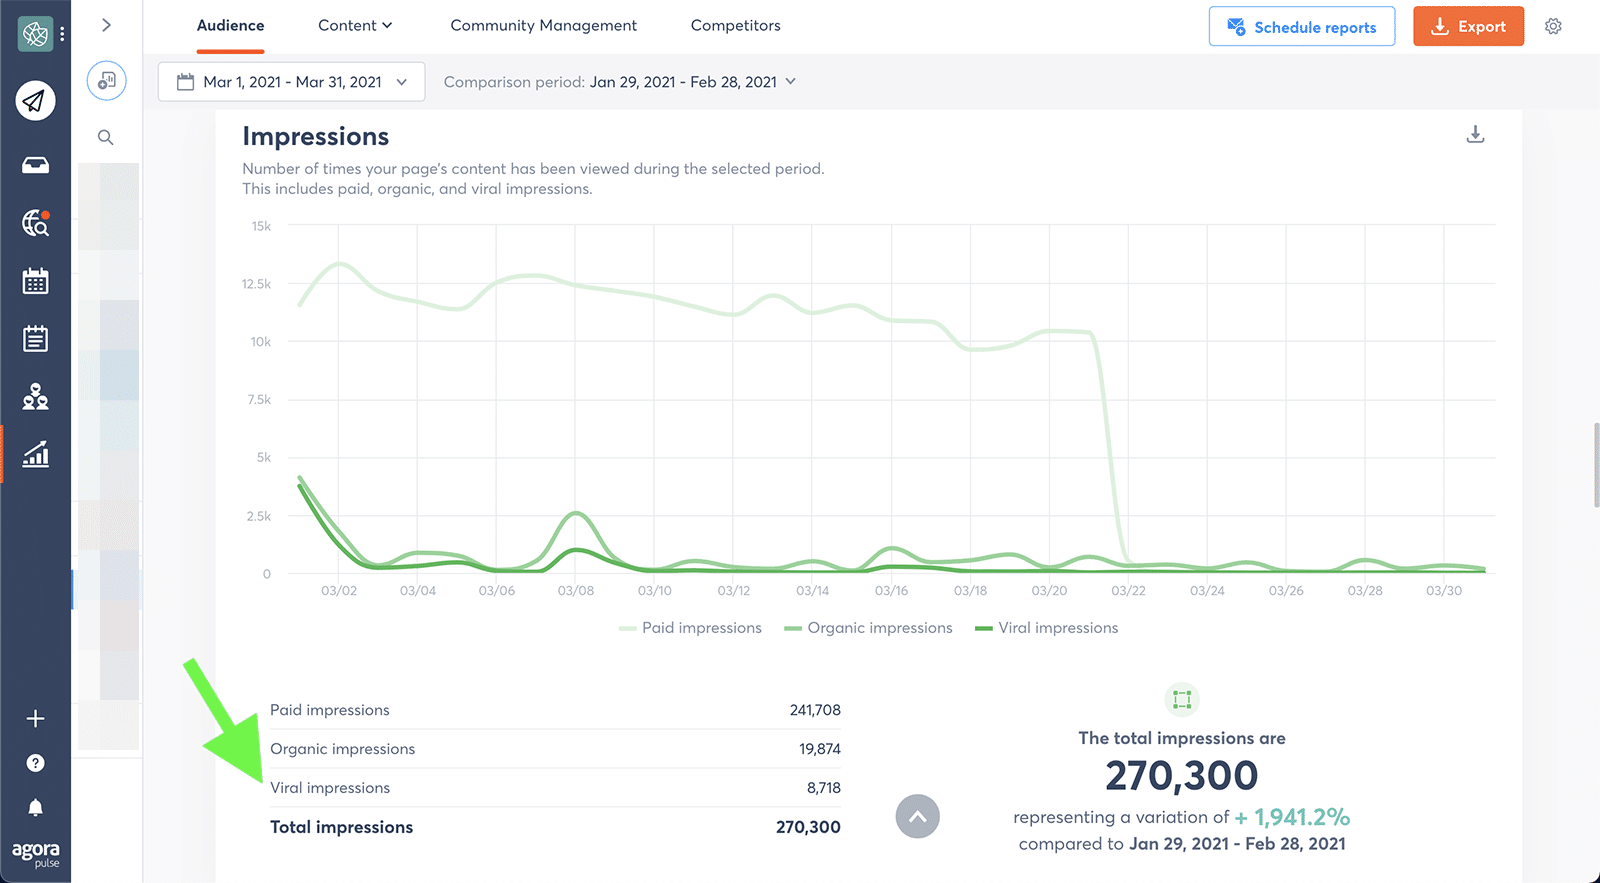
Impressions are the number of views, or times your content appeared on a social media user’s timeline.
This metric is usually higher than reach because impressions count when a post appears on the same user’s timeline multiple times.
With Agorapulse, you can track impressions per post or per period of time for select channels.
Audience growth
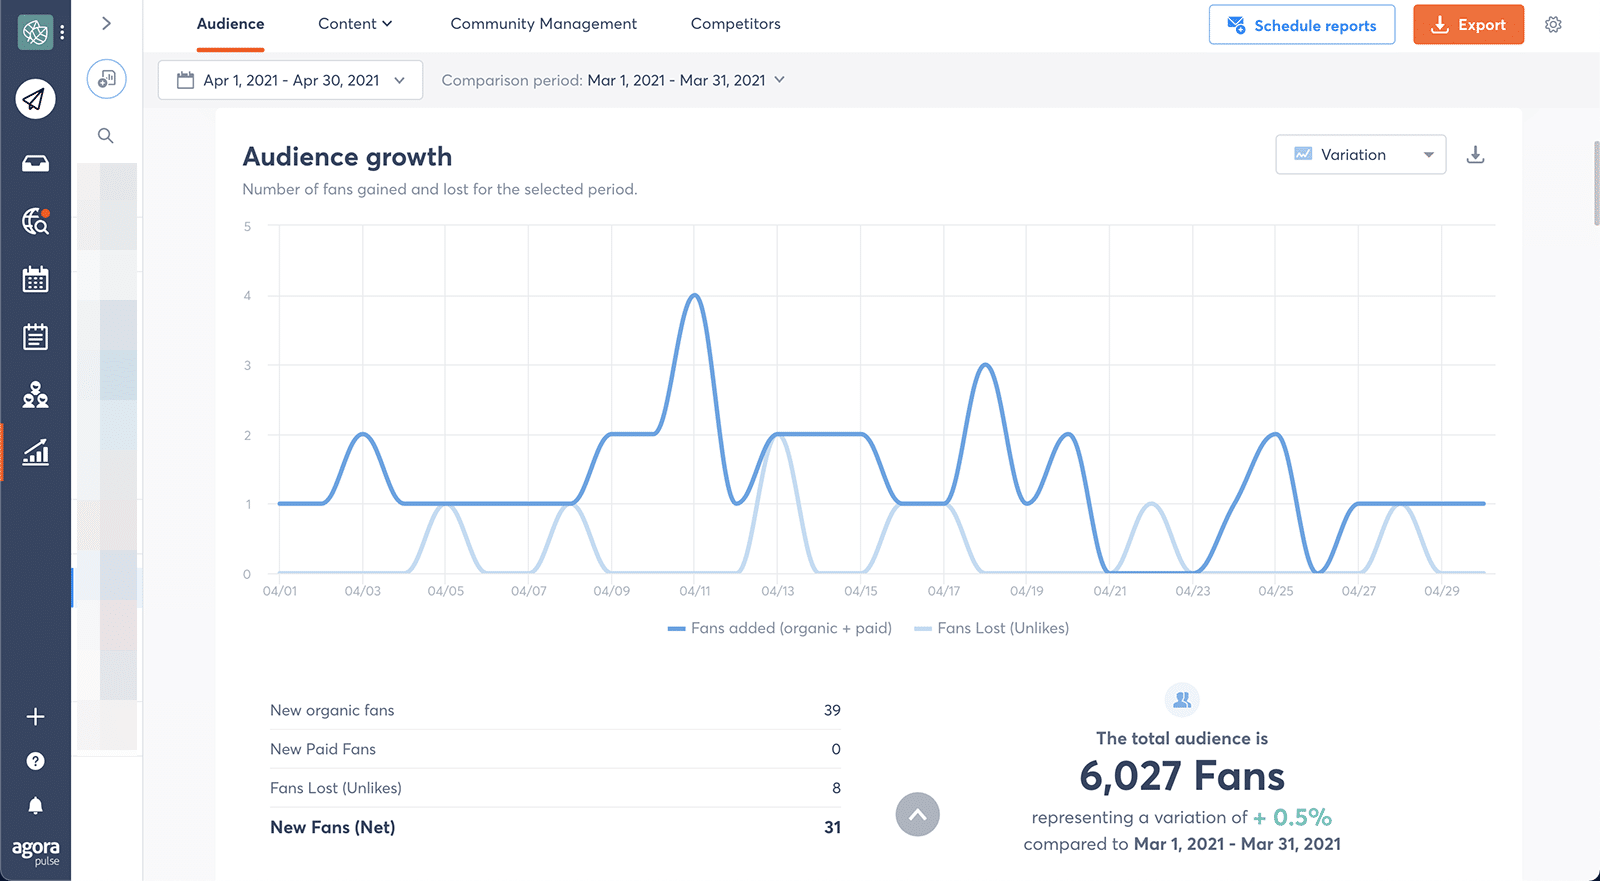
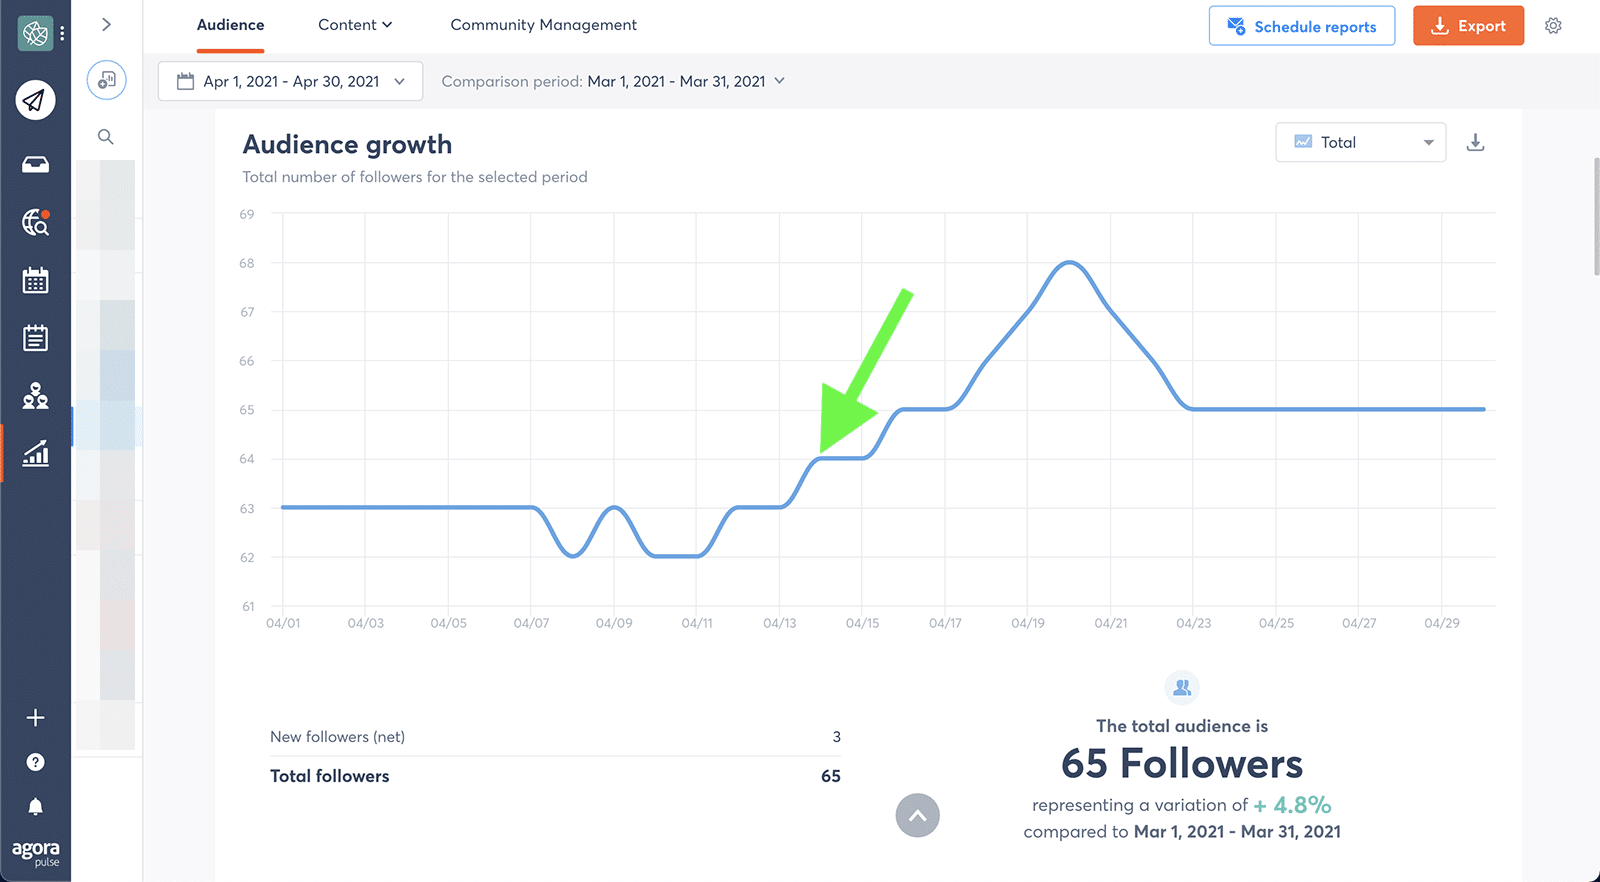
Audience growth refers to any changes in your follower numbers. This metric includes gains, losses, and a net number of new fans.
Agorapulse tracks audience growth over time so you can easily identify when you gained or lost the largest number of fans.
If you find outliers–such as days with large gains–you can refer to your publishing schedule and engagement history to determine what contributed to the growth.
Social share of voice
Social share of voice (SSoV) is a comparative metric that measures how many people are talking about your brand versus your competitors. It’s designed to help you gauge brand visibility in your market or niche.
To measure SSoV, use a social listening tool to monitor direct and indirect mentions of your brand and your competitors. Add them together to get a total, and then divide your mentions by this total. Turn it into a percentage to get your SSoV.
Customer sentiment
Customer sentiment reflects whether your engagement is generally positive or negative.
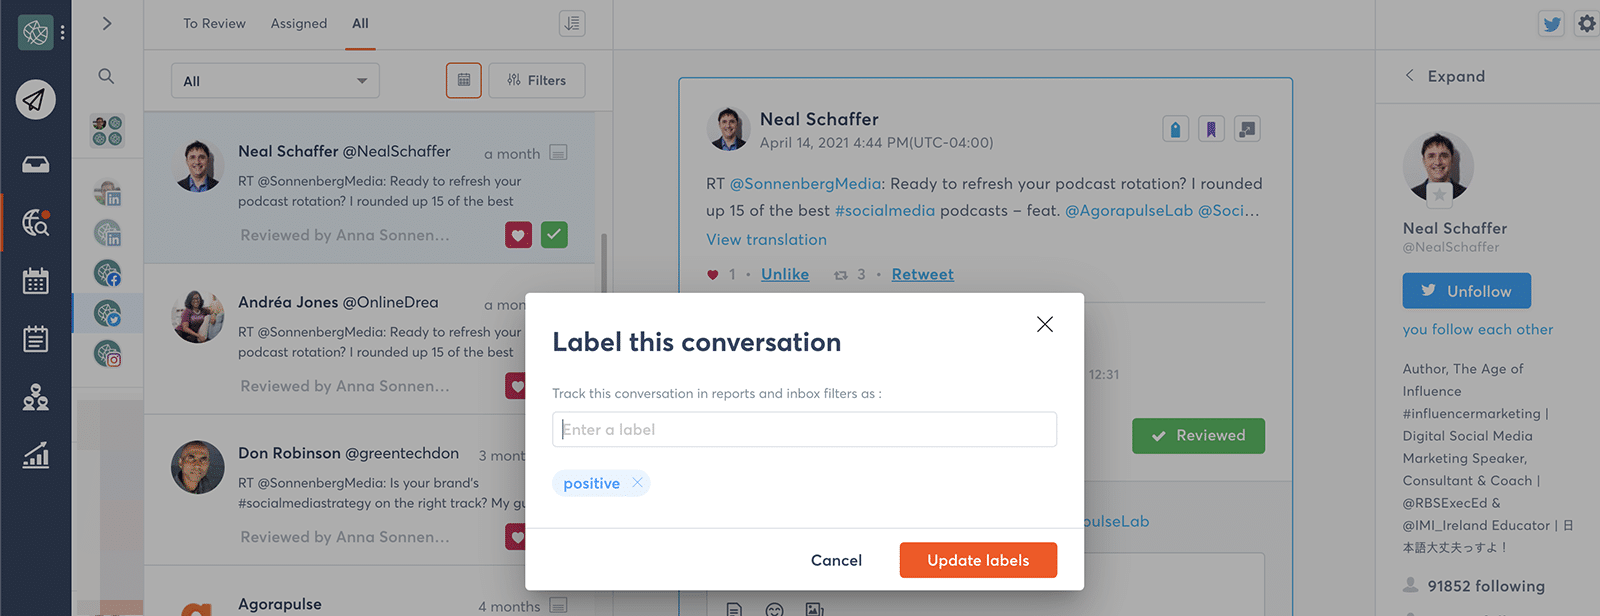
To monitor this metric, review your Social Inbox and manually give each item a label with a rating, such as positive, neutral, or negative.
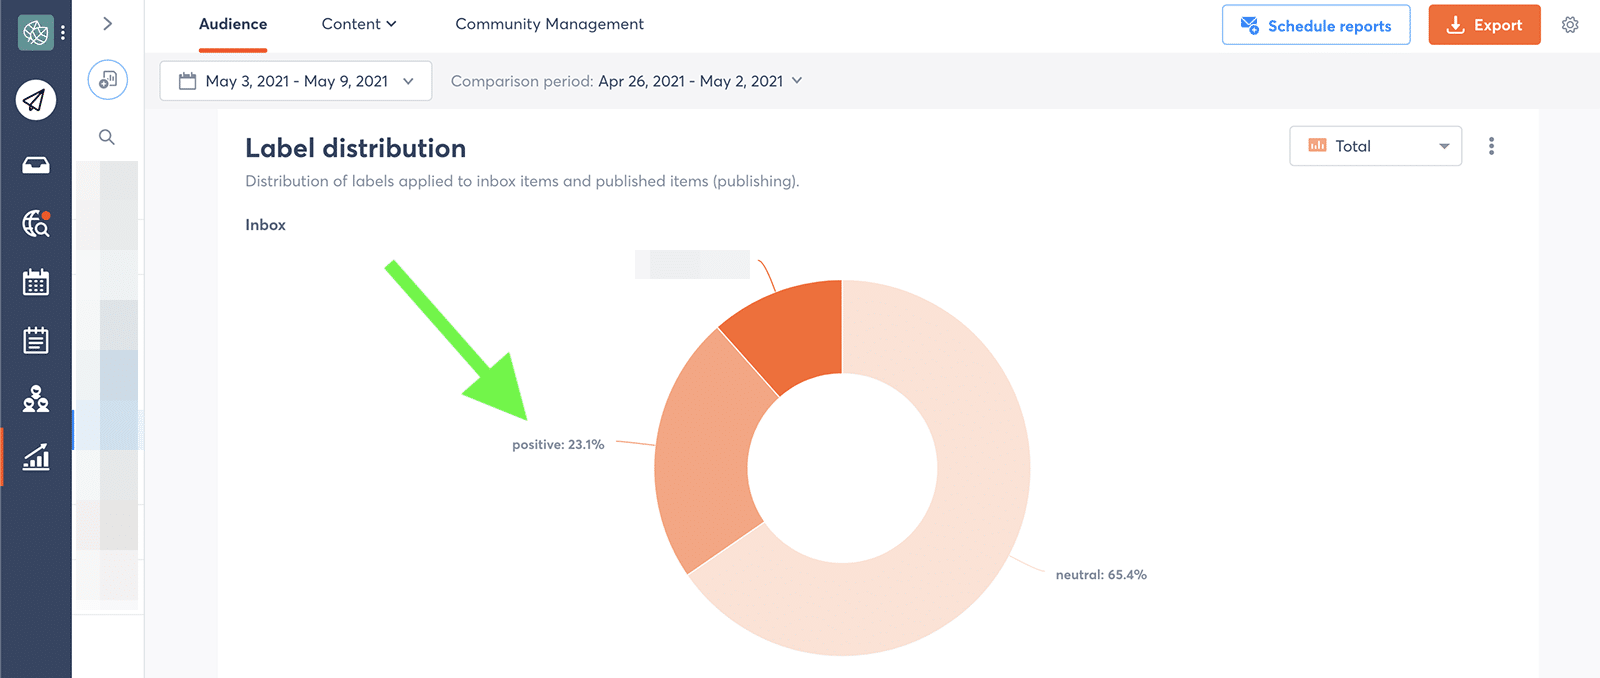
Then check your Agorapulse report to see a breakdown of the various sentiments.
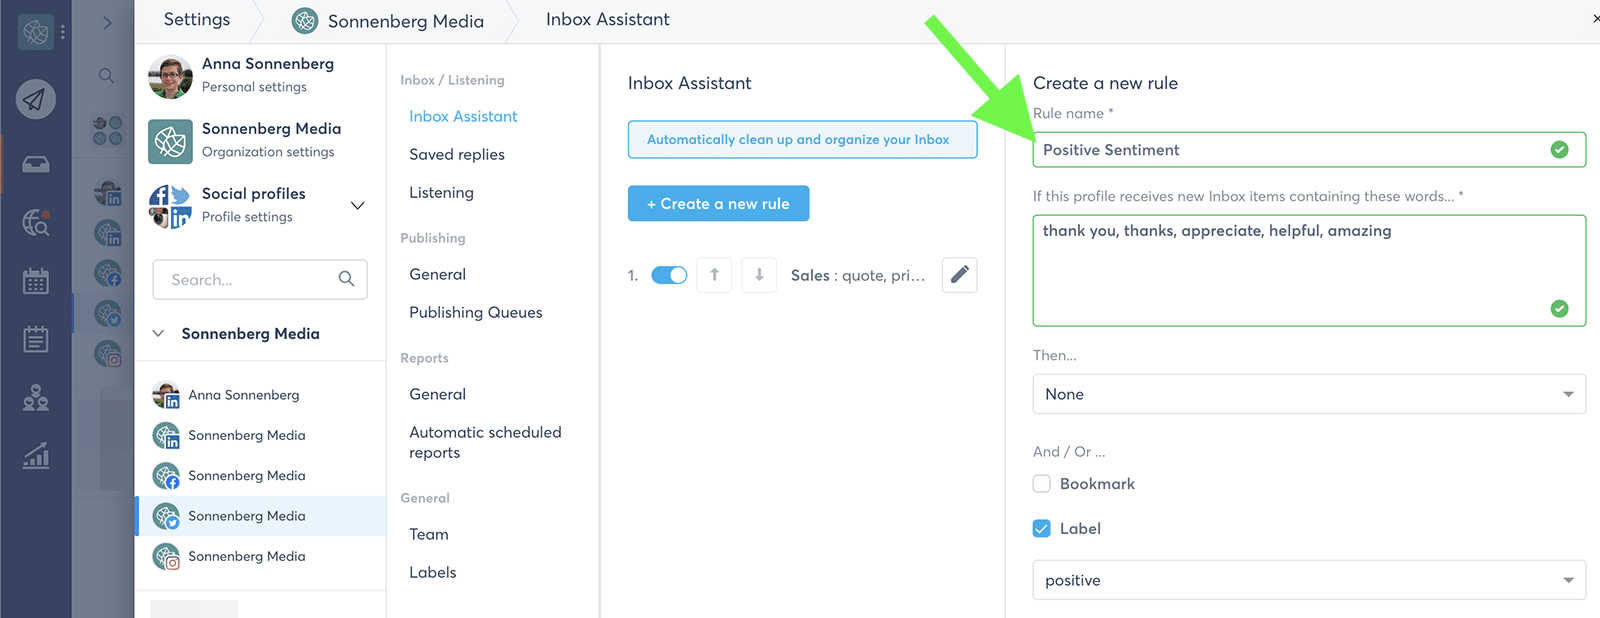
If your profiles receive a lot of engagement, you can also label items automatically with Agorapulse.
Set up an Inbox Assistant rule to apply labels when inbox content contains certain positive or negative words. Your Agorapulse report will then apply and track sentiment automatically.
Engagement Metrics
These metrics demonstrate how followers interact with your content and social media profiles.
Quick overview of engagement metrics
- Likes
- Comments
- Shares
- Clicks
- Virality rate
- Amplification rate
Let’s dive deeper into those metrics. (You can also sign up for a free trial of Agorapulse and start seeing these metrics for yourself!)
Likes
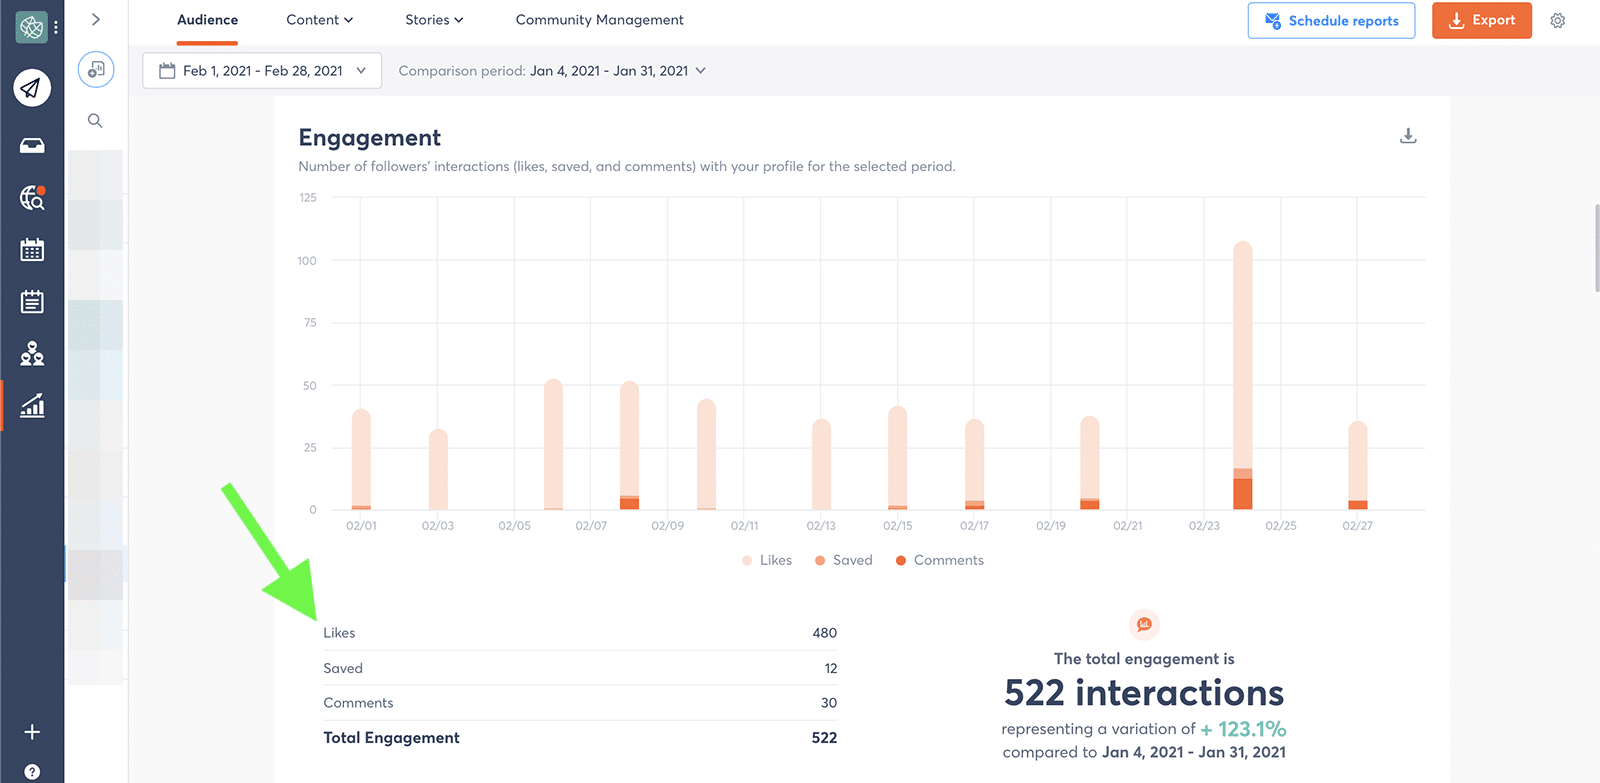
Likes include all the thumbs up and double taps your content receives. This metric generally reflects positive engagement, so it can be a good measure of how many people appreciate your content.
You can track the number of likes your posts get via Agorapulse’s content report. Agorapulse automatically calculates the number of likes for each post and the average number of likes during the time frame.
Comments
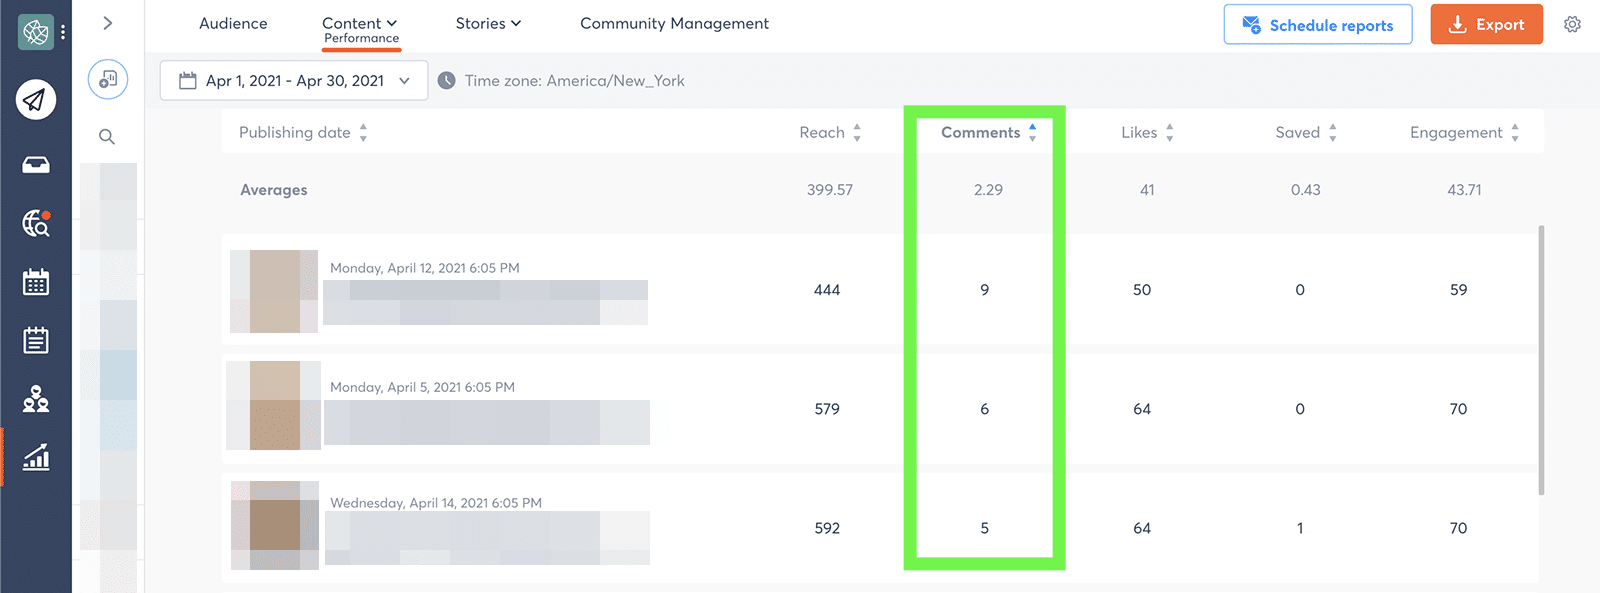
Comments are the number of notes that social media users leave on your posts. Whether they’re positive, negative, or neutral, comments can contribute to your overall engagement metrics.
You can track comments with Agorapulse’s content report, which shows comments per post as well as an average for any given time frame.
Shares
Shares are the number of times a user reposted or retweeted your content on their own timeline.
In many cases, shares indicate a higher level of engagement than likes alone, and they can boost your brand’s reach. Agorapulse automatically tracks shares on your audience and content report.
Clicks
Clicks reflect how many times someone tapped a URL you posted and visited the linked website. If you want to monitor the amount of website traffic your social media content drives, this is an important metric to track.
Clicks appear in Agorapulse content reports for most supported social channels.
Virality rate
Virality rate means the percentage of people who shared your content compared to the number of impressions it receives.
This rate helps you look past more basic engagement metrics like comments and shares and identify what makes your brand’s content go viral instead.
You can easily calculate the virality rate by checking your Agorapulse content report for shares and impressions. Then divide the shares by the impressions and convert the number into a percentage.
Alternatively, Agorapulse automatically tracks viral impressions for select social channels like Facebook.
Amplification rate
Amplification rate is a percentage that compares the number of shares of a post to the number of followers a profile has. A higher amplification rate means more people are committed to promoting your brand to their followers.
You can calculate the amplification rate for any post by noting the number of shares or retweets in your Agorapulse content report.
What’s the Best Time to Tweet?
Make note of the date when the post was published.
Then click over to your audience report and check the total number of followers your profile had on that date. Divide the number of shares by the total number of followers and turn the result into a percentage.
Conversion Metrics
This data reflects high-intent actions like sales and conversions.
Quick overview of conversion metrics
- Click-through rates
- Cost per click
- Referrals
- Bounce rate
- Conversions
Let’s explore those further.
Click-through rates (CTRs)
CTR indicates the ratio of people who clicked the link you shared versus the number of people who viewed the post.
It’s basically a comparison of clicks to impressions.
When you track CTRs for your content, you can gain a deeper understanding of what drives people to click. Over time, your team can work to produce more of the same high-performing content.
To calculate CTRs for your posts, go to your Agorapulse content report and check the clicks and impressions.
To get the CTR, divide clicks by impressions and convert the number to a percentage.
Cost per click (CPC)
CPC is a paid social metric that indicates what you have to pay for each click.
When you want to drive traffic to your website, it’s essential to keep this number as low as possible–or at least ensure that it doesn’t exceed the amount your team intends to pay.
To calculate CPC for a paid social campaign, divide the amount you spent on the campaign or ad set by the number of clicks. Most social media advertising platforms automatically track this metric for every campaign.
Referrals
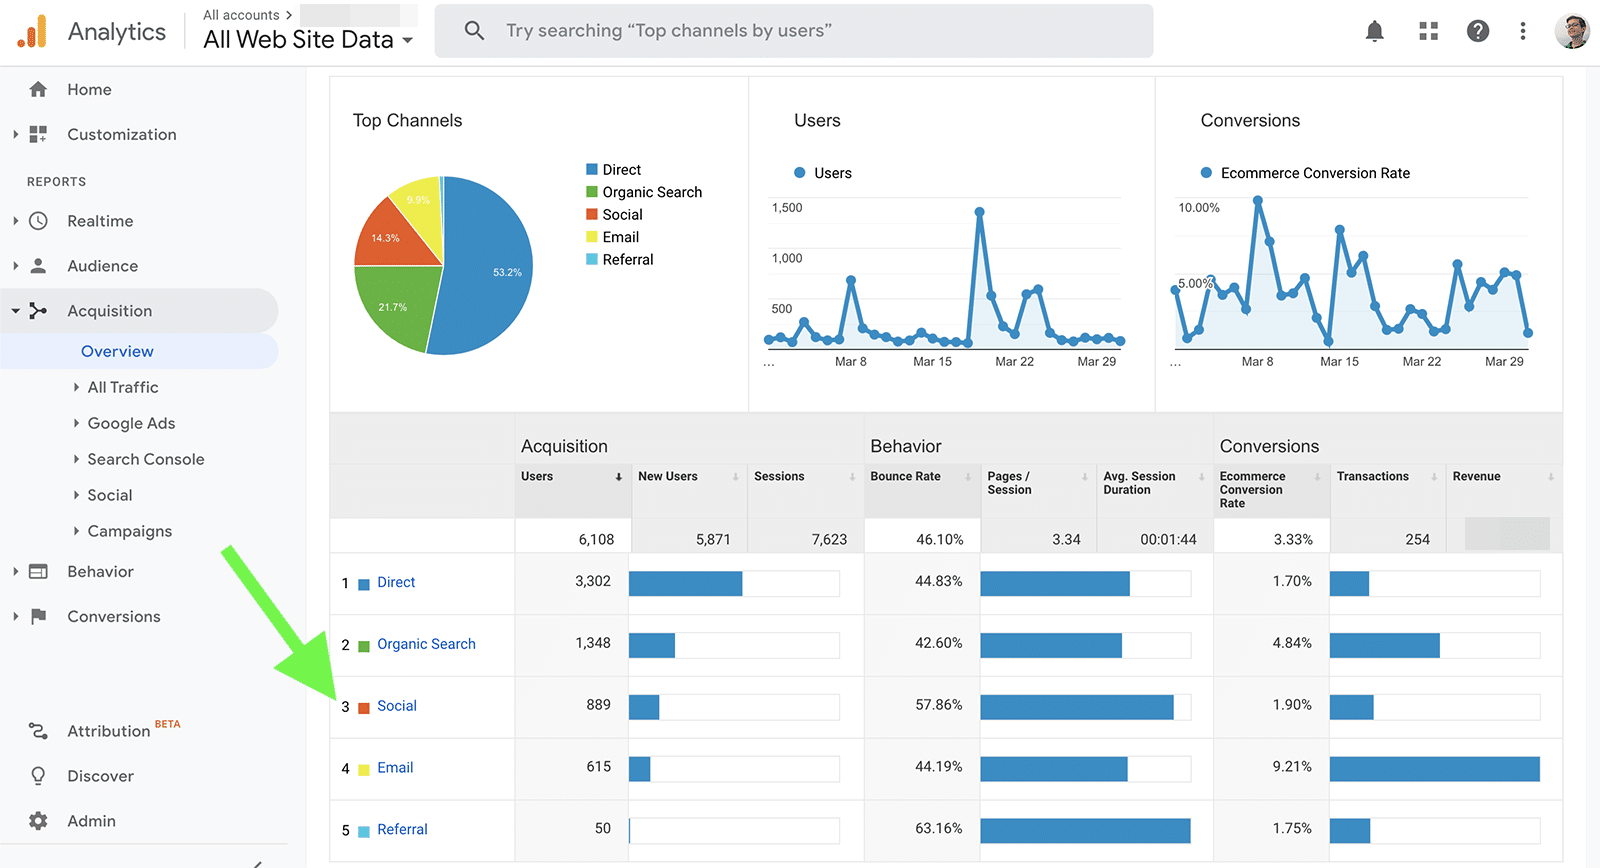
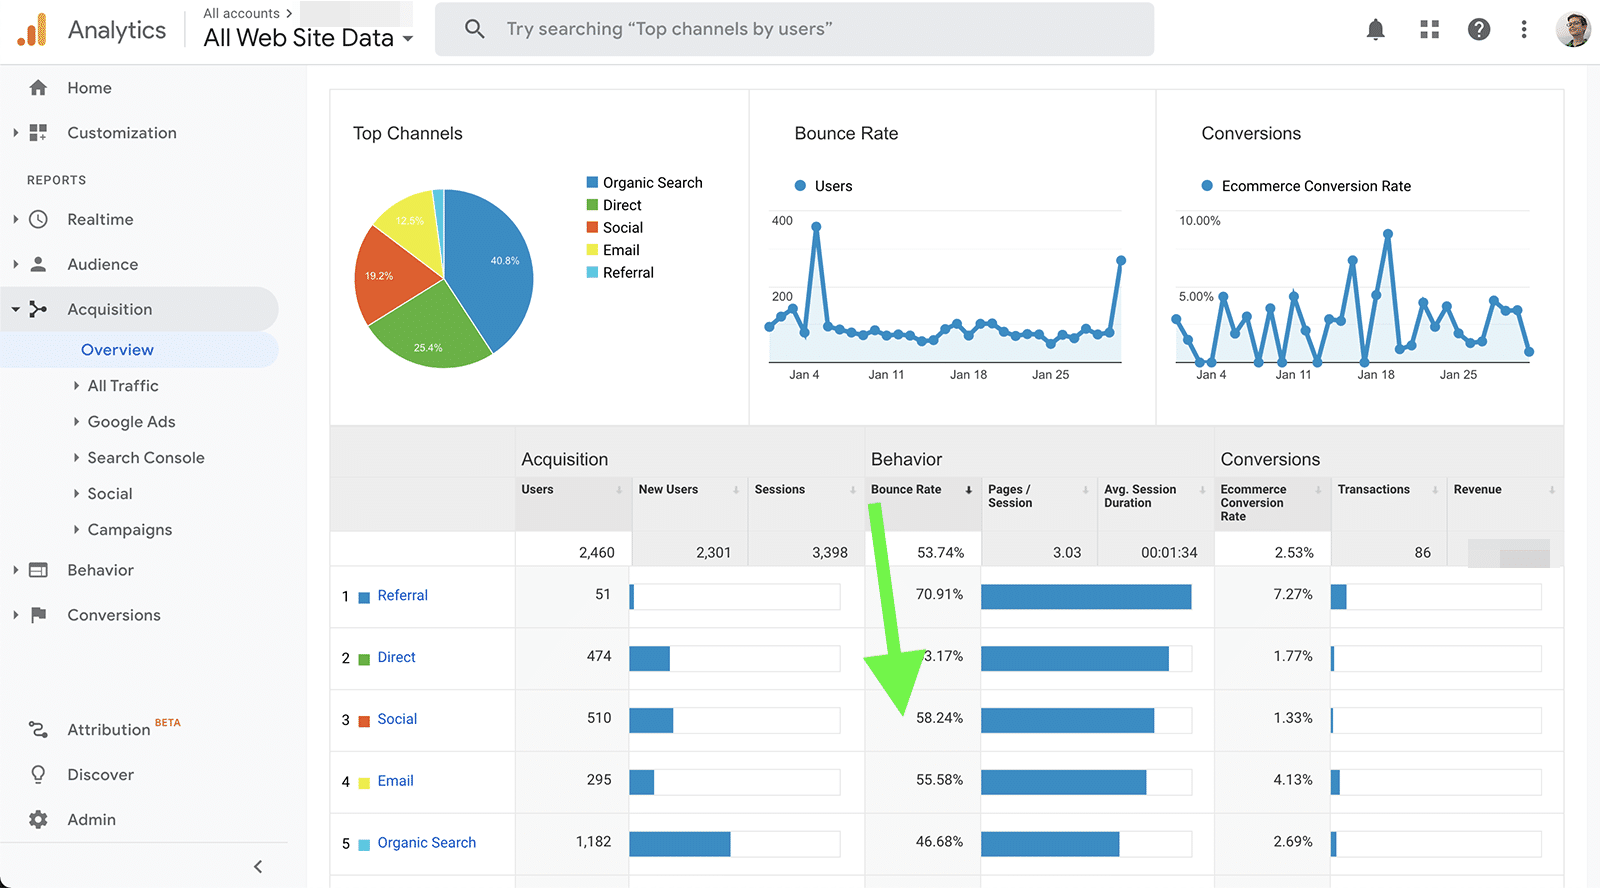
Referrals indicate that another platform has driven traffic to your website. Social media managers often monitor social referrals, as this metric helps you identify which channel generates the most traffic. You can also use this data to determine what kind of actions social referrals take, including conversions or other page views.
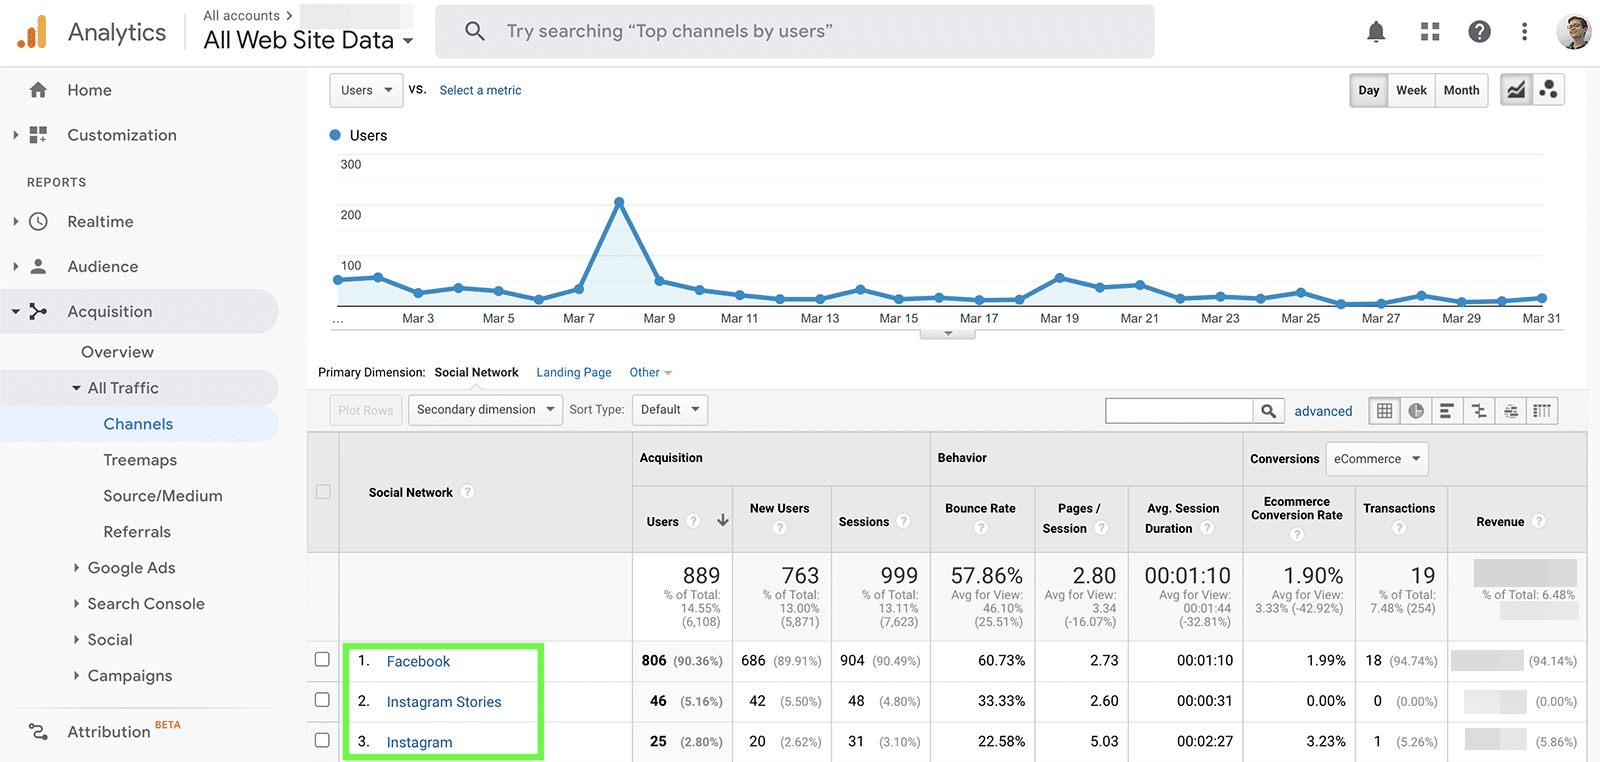
Google Analytics automatically tracks which channel social referrals come from. But it doesn’t offer much more of a breakdown automatically.
If you add UTM parameters to the content you post on social media, you can track results from each post or campaign in Google Analytics.
You can add UTM parameters when scheduling content in Agorapulse’s publishing dashboard.
Bounce rate
Bounce rate refers to the percentage of people who click away from your website right away, without taking an action or visiting additional pages.
A lower bounce rate means visitors are more engaged with your website content.
Google Analytics automatically tracks the bounce rate for each channel, including social referrals. If you set up UTM parameters, you can dig deeper into the analytics and find out which campaign drove the most engaged visitors.
Conversions
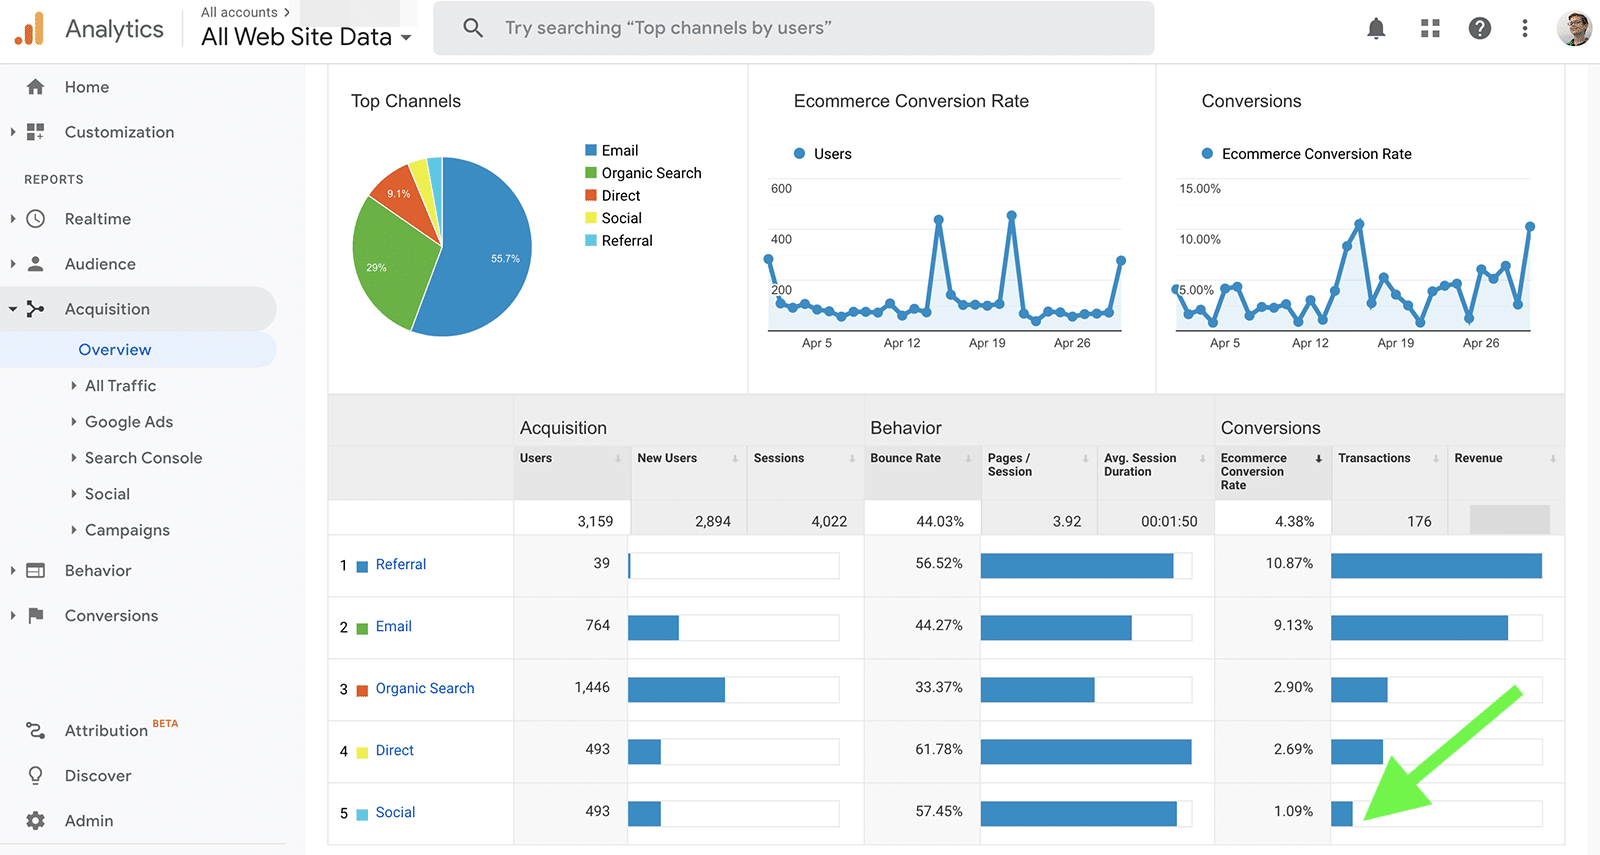
Conversions can have different meanings for different brands, from a purchase to a lead form submission.
No matter which conversions matter to your brand, you can track this metric with Google Analytics. You can set up e-commerce tracking or create your own custom goals for important conversions.
Then you can check conversion numbers or rates for social referrals, channels, or campaigns. If you’ve created UTM parameters for your social media content, it’s easy to identify which campaigns drive the most conversions.
Advocacy Metrics
These metrics for social media track brand advocates and customer satisfaction.
Quick overview of advocacy metrics
- Testimonials
- Satisfaction
- Net Promoter Score
Testimonials
Testimonials are positive customer reviews of your brand, product, or service. Customers can provide testimonials in comments and DMs, or they can mention your brand in their own social media posts.
Select social media channels–such as Facebook–also allow users to leave public reviews.
All these types of engagement automatically appear in Agorapulse’s social and listening inboxes.
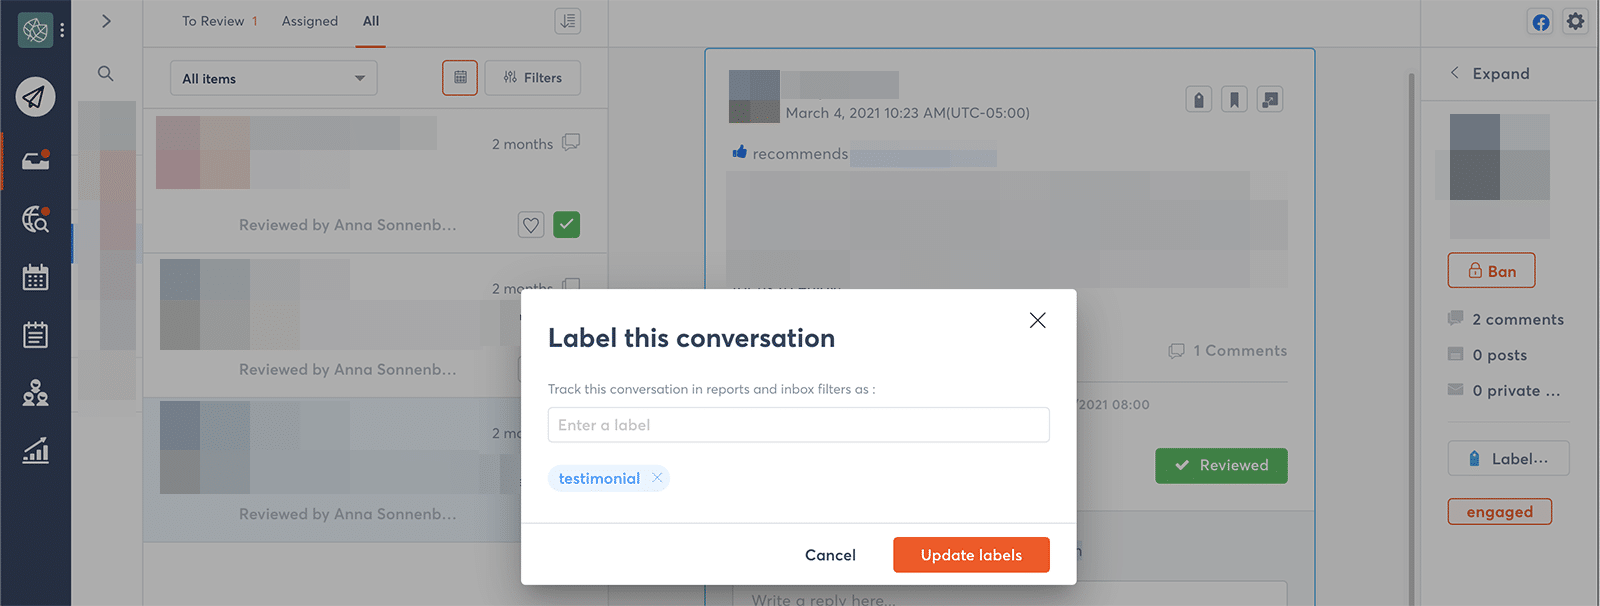
To keep track of all the testimonials you receive, label all relevant items as you review them.
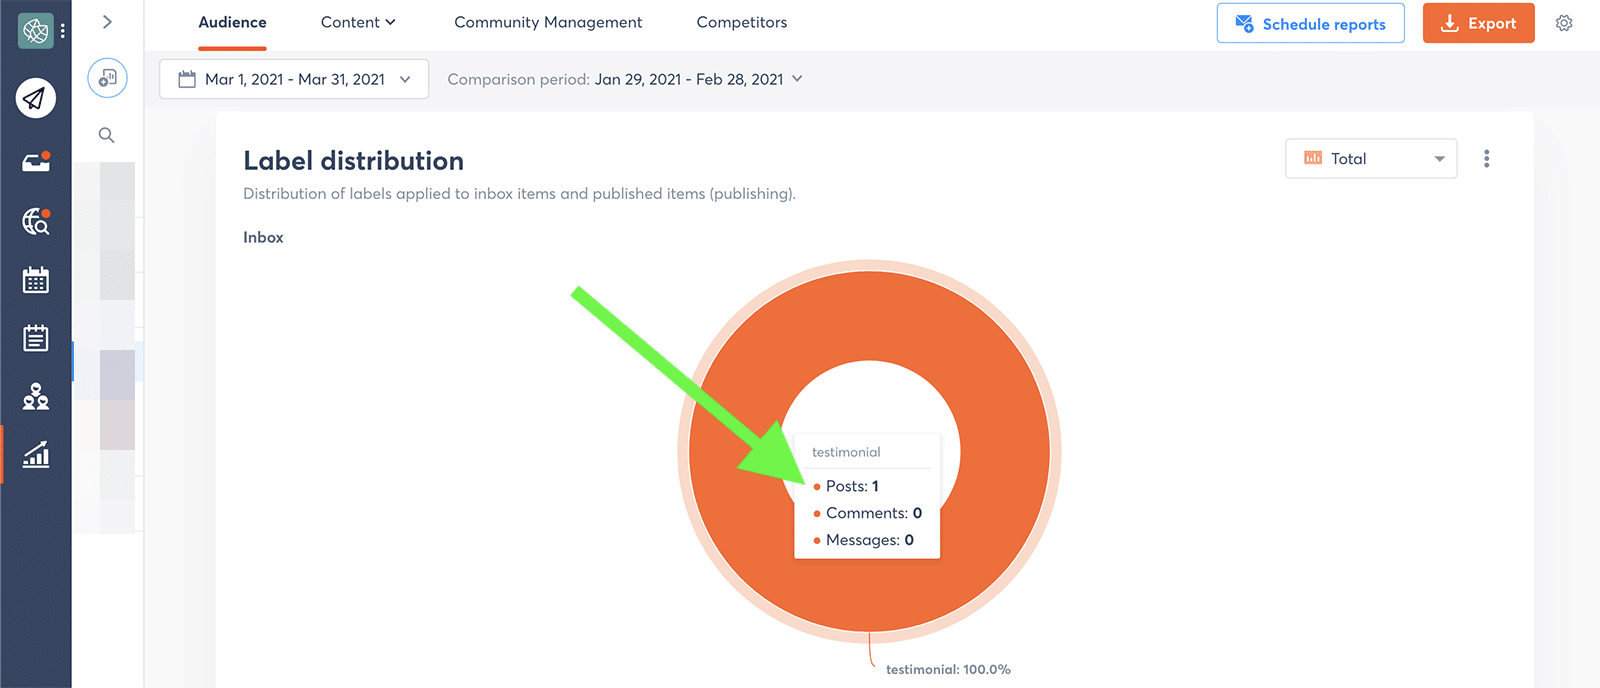
Check the label distribution section of your Agorapulse report for a total testimonial count over any time period.
Satisfaction
Customer satisfaction rate measures how pleased people are with your company’s offerings.
To monitor this metric, create a social media poll that asks customers to rate their satisfaction with your products or services on a scale of 0% to 100%. When the poll closes, add up all the ratings and divide by the number of responses to get your brand’s customer satisfaction rate.
Net Promoter Score
Net promoter score assesses how likely a customer is to recommend your brand to someone else.
Monitoring this metric also requires a social media poll. Ask customers to rate how likely they are to recommend your products or services on a scale of 0 to 10. Then add the scores and divide by the number of responses to calculate your net promoter score.
Customer Care Metrics
This data reveals how quickly and effectively your team addresses customer engagement.
Quick overview of customer care metrics
- Response time
- Response rate
Response time
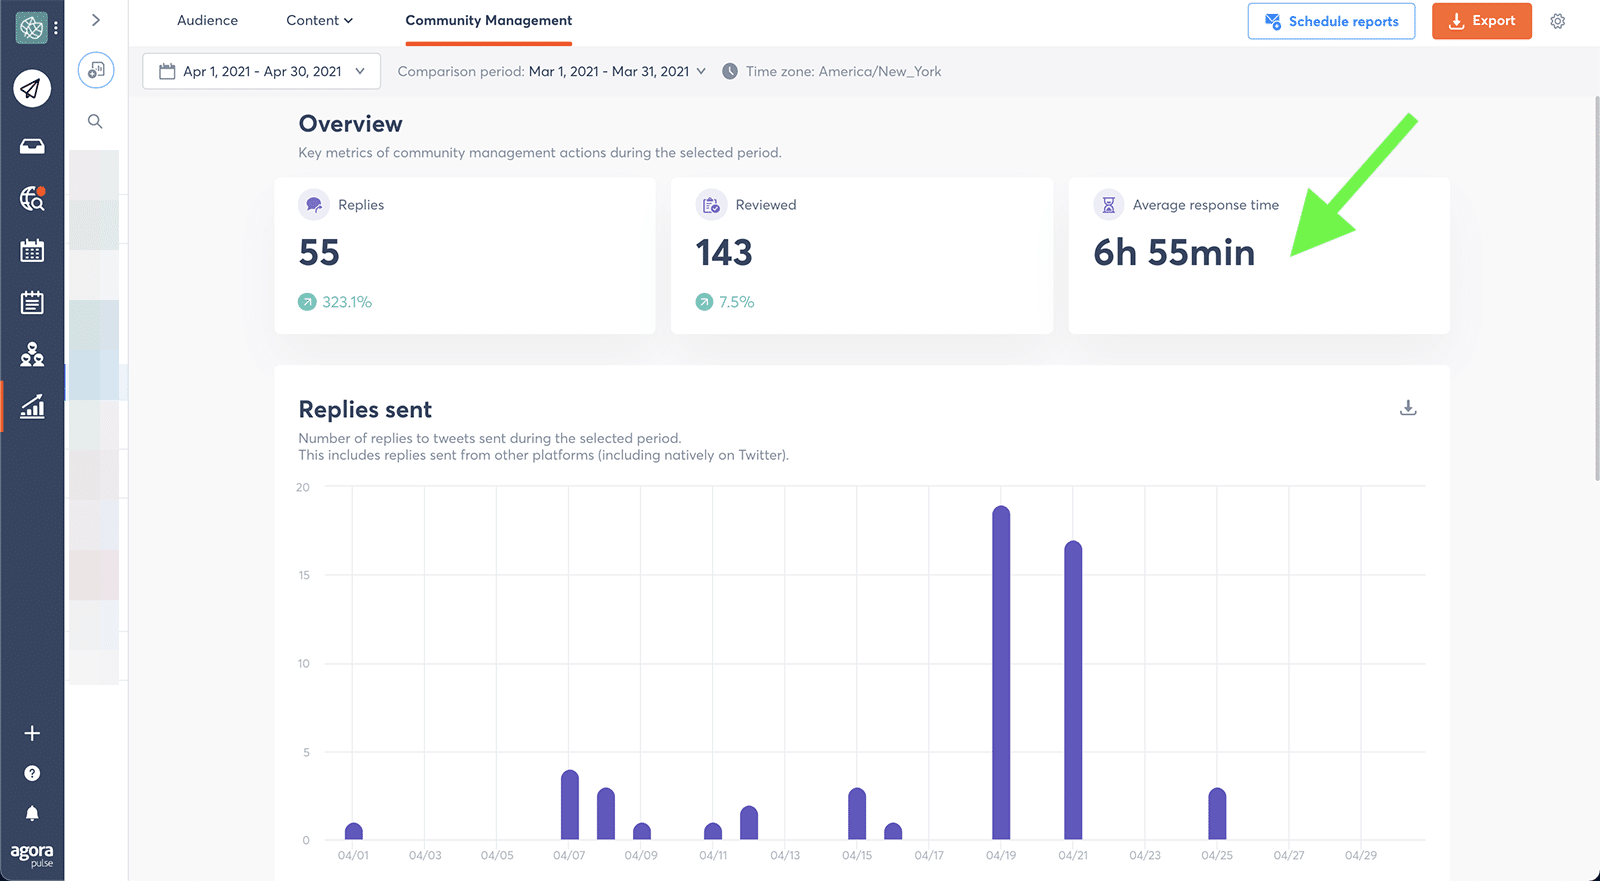
Response time refers to the amount of time it takes your team to respond to social media engagement. Faster response times can improve customer sentiment and satisfaction, making this an essential support metric.
Agorapulse’s community management reports automatically track this data so you don’t have to. You can view the average response time for your entire team or check team member stats to get a more granular look at performance.
Response rate
Response rate indicates the percentage of inbox items your team replied to. If your team has set a goal of responding to as much engagement as possible, this is a critical metric. You can easily calculate the response rate by dividing the number of replies by the number of reviewed items for any time period.
Vanity Metrics to Avoid
Not every measurement deserves a spot on your team’s social media metrics report.
Some might seem important but really aren’t worth your team’s time. These vanity metrics typically offer the illusion of success but are ultimately empty metrics.
Most common examples of vanity metrics
- Followers. Instead of tracking your account size, consider digging deeper to monitor follower demographics or engagement per follower.
- Impressions. Rather than fixating on impressions or reach, take a closer look at how these metrics change over time to ensure you’re achieving the growth you want.
- Clicks. Don’t stop at monitoring social media-driven clicks. Use UTM parameters to track user behavior on your website and determine whether these clicks offer additional value, such as conversions or purchases.
In Conclusion
By knowing which analytics to monitor and using an automated social metrics tracker, your team can stay on top of what matters most. As a result, you can help your team succeed and achieve ambitious social media goals.
Take control of your social media! Check out our free trial of Agorapulse to help you schedule, track, and measure all your social media efforts.


