

Marketing your brand on Twitter is a smart choice for many businesses–especially if your target audience fits with the platform’s main demographic groups. But before you invest a ton of resources into a Twitter strategy, you need to know how to measure your efforts.
Get to know the Twitter metrics that matter, and find out how to track them using a social media solution like Agorapulse.
Why Twitter Metrics Matter
When your team is pressed for time or short on resources, make sure that your efforts are worthwhile.
Monitoring Twitter metrics allows your team to:
- Pinpoint what your target audience likes. You’re much more likely to achieve your Twitter goals when you post content that prompts positive engagement. When you keep an eye on the Twitter metrics that matter to your team, you can easily identify tweet performance and engagement rates–and see what drives results.
- Cut content that doesn’t deliver results. Why take the time to create the kind of content that your followers scroll past? With regular reporting, you can see what isn’t working–and rework your strategy accordingly.
- Get a better grasp on generating value. Likes and retweets are great, but do they really provide a reasonable return on investment (ROI)? When you track the right Twitter metrics, you can determine what generates the most value and adjust your social media strategy as necessary.
- Make smarter marketing decisions. When you know what generates the best value for your brand, you can develop more effective Twitter campaigns and content. Your team can also be savvier with resources, so your work can make the maximum impact.
Twitter Audience Growth
Is your brand’s Twitter account growing, plateauing, or shrinking? To reach your target audience effectively, make sure you’re always attracting new Twitter followers.
In theory, you could just check your profile’s follower numbers every few weeks or months. However, it’s helpful to take a more measured approach to Twitter growth.
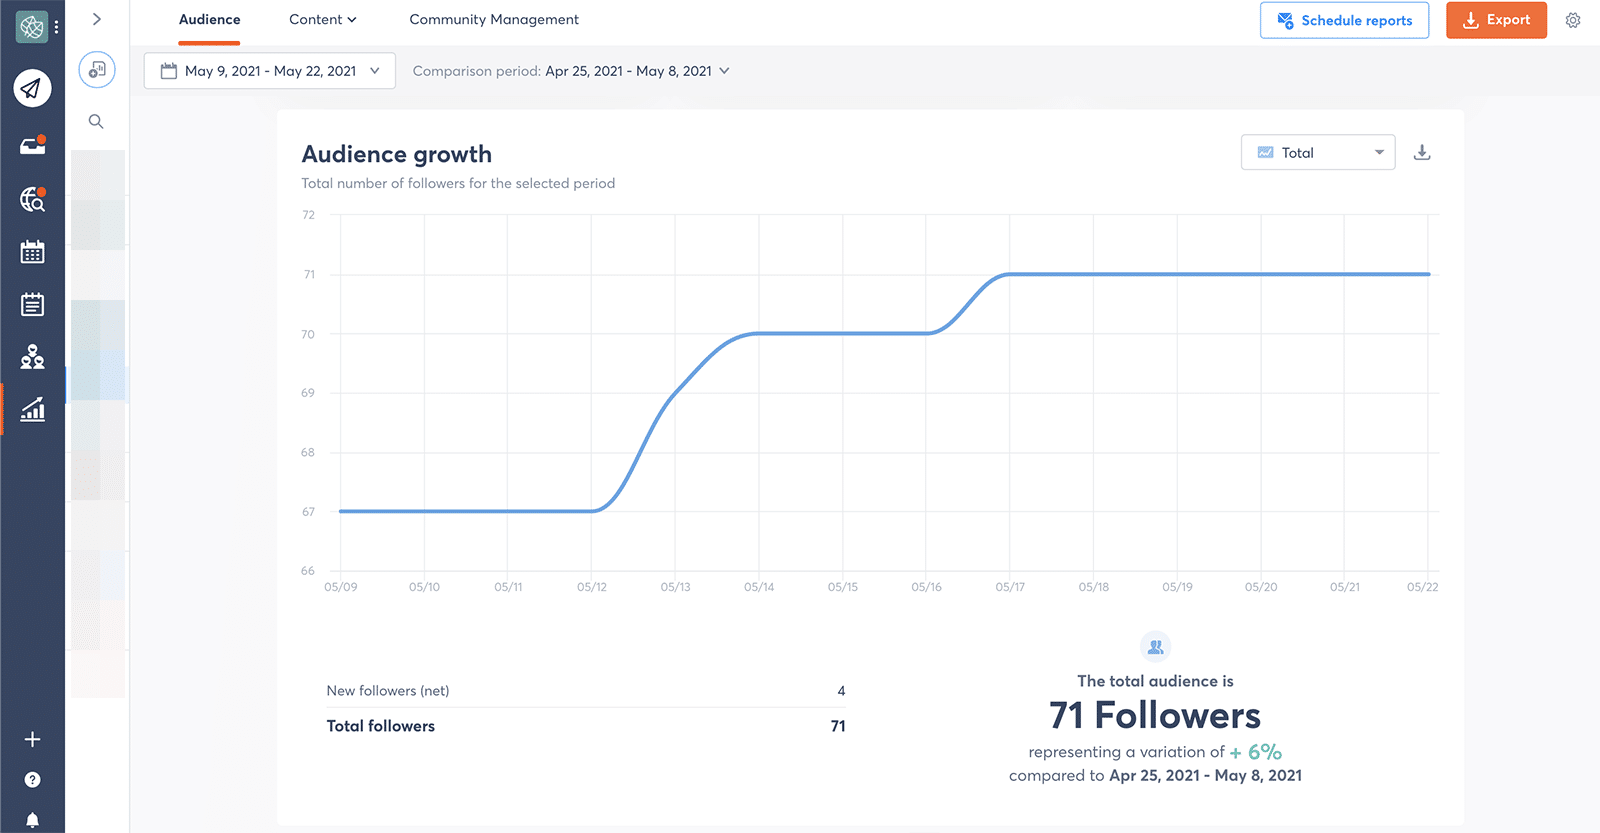
Rather than casually keeping tabs on your numbers, use Agorapulse’s audience growth report to keep track of key follower metrics. Check the Total graph to see how your audience size has changed over any time period.
Did you spot an unusual dip or a big jump in followers?

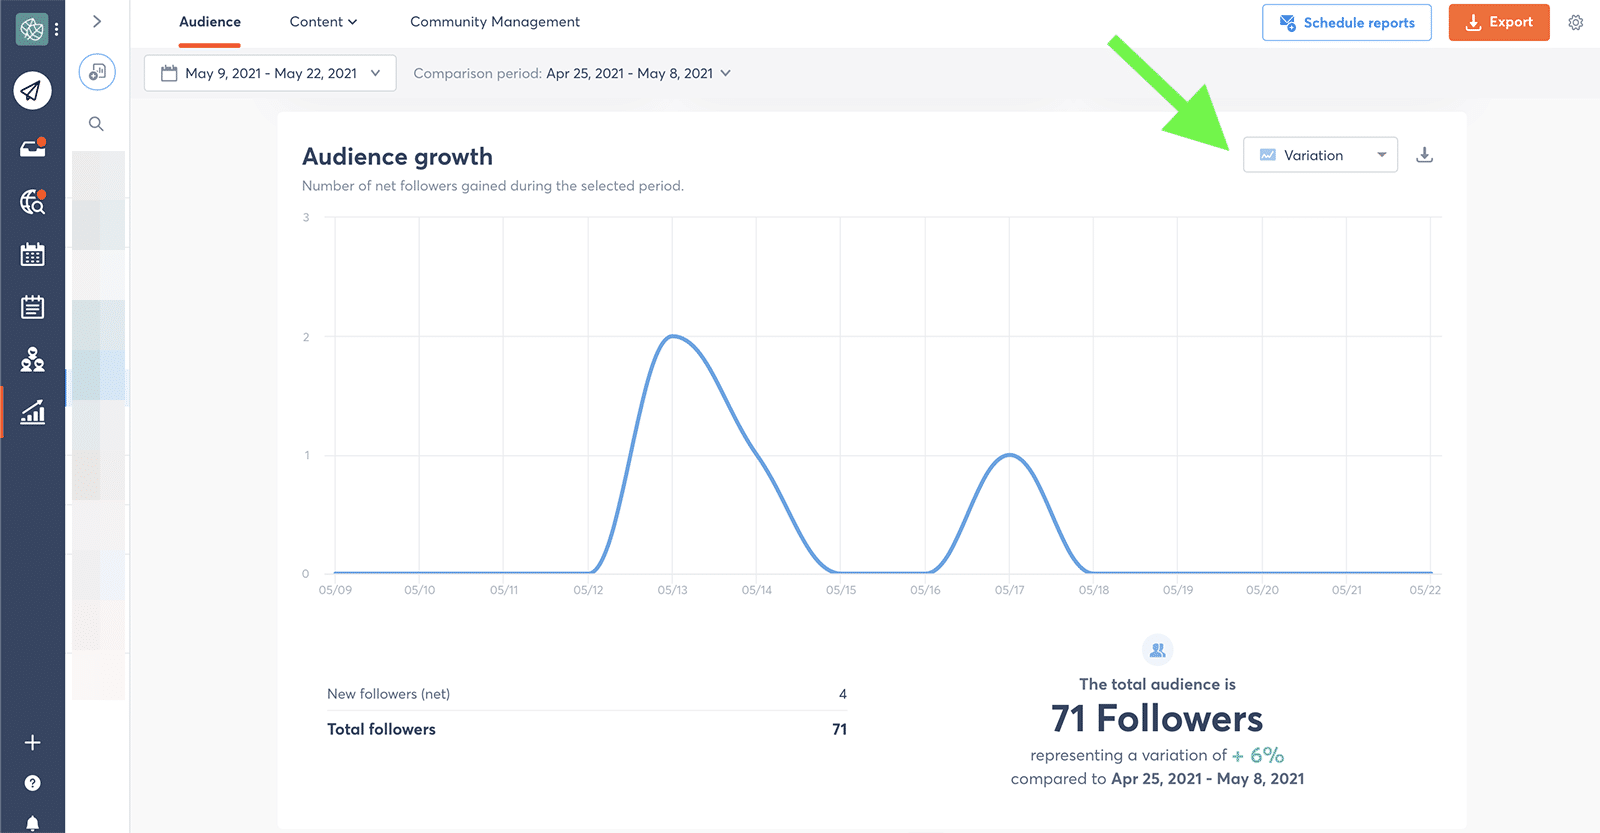
Switch to the Variation graph to get a closer look at day-to-day changes. If you see any outlier activity–such as way more new followers than normal–check your content report (see below) to see if posts you published on that day drove a higher-than-normal amount of engagement or exposure.
Twitter User Activity
As you grow your brand’s audience, your profile is bound to receive more engagement. Quick responses to DMs and mentions can help your brand appear more human and build credibility.
Anyone can @ your brand at any time, but you can see when people are more likely to interact with Agorapulse’s user activity metrics. This automated report uses your profile’s DM and mention history to chart when Twitter users are most likely to interact with your brand.
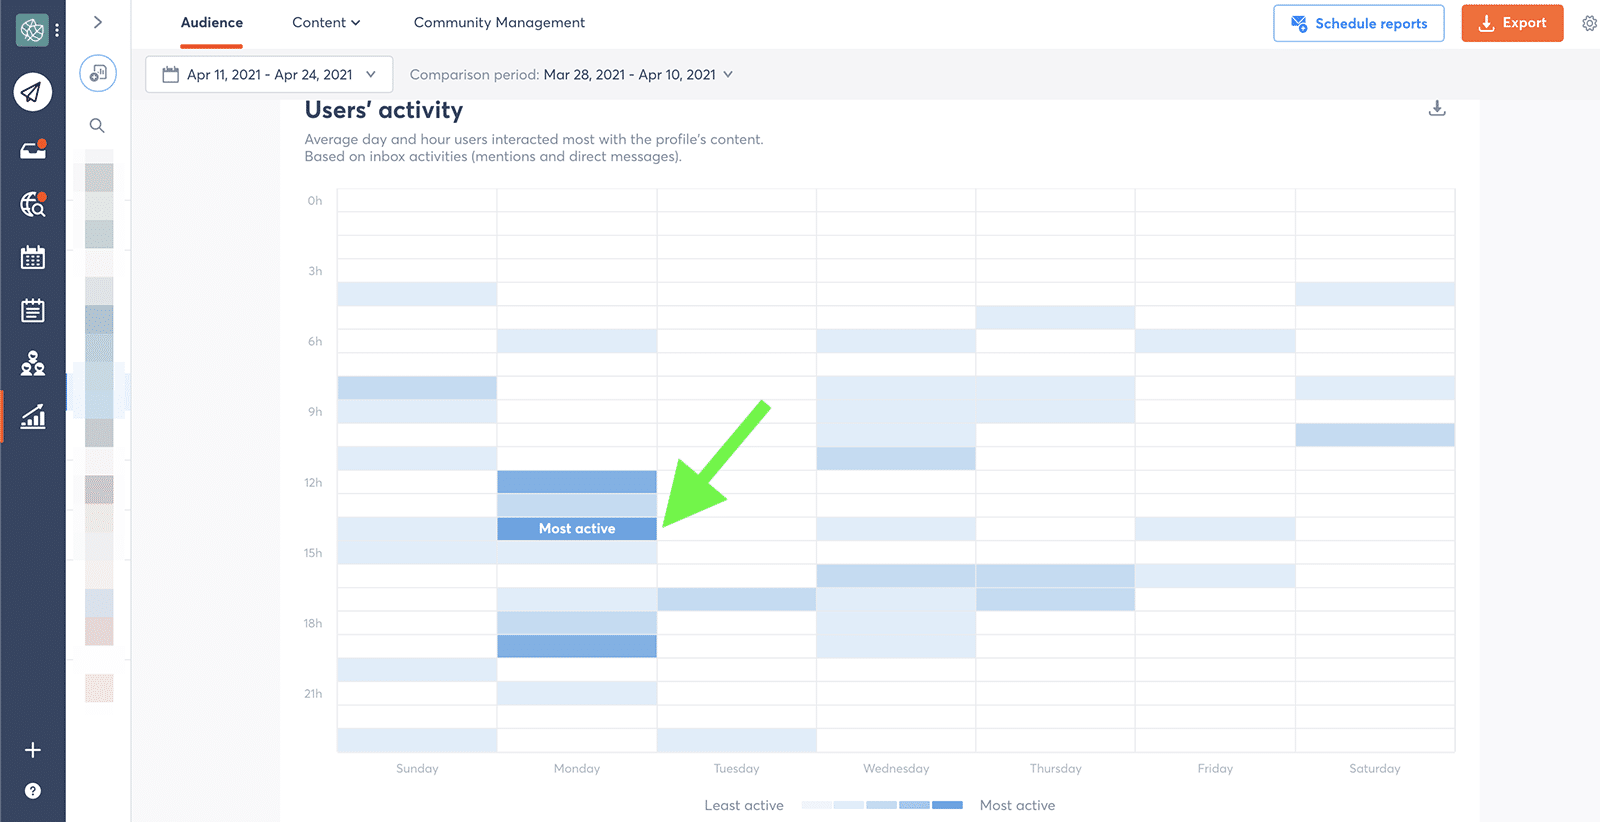
If you have a small team or limited time to spend on Twitter, this chart can be a lifesaver. Rather than dropping everything to respond to Twitter notifications, your team can commit to being active during your audience’s busiest times and days.
Find out the best time to post on social media channels
Twitter Engagement
Building a bigger following is critical for growth. But audience numbers alone can’t guarantee success on Twitter.Make sure your content prompts engagement, too.
You can use Agorapulse’s engagement and content reports to track all the interactions your posts generate.
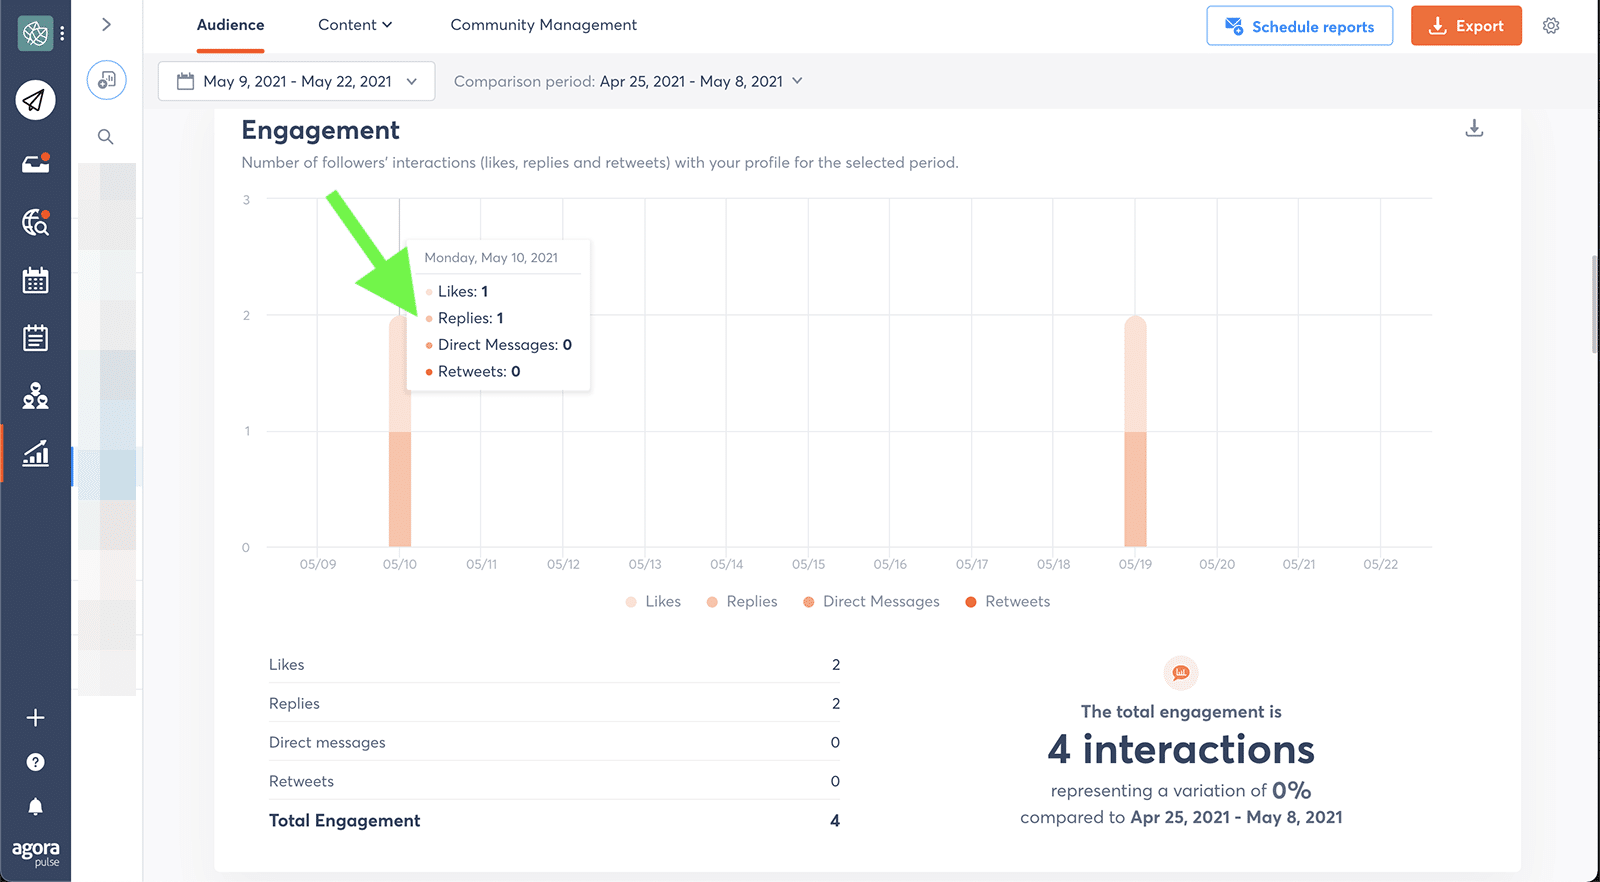
Likes
Monitoring likes is a great way to get a quick glimpse of your audience’s interest levels.
If your content generates a lot of likes, it’s safe to assume that your posts resonate with your audience. If not, you might want to revisit what and how often you tweet.
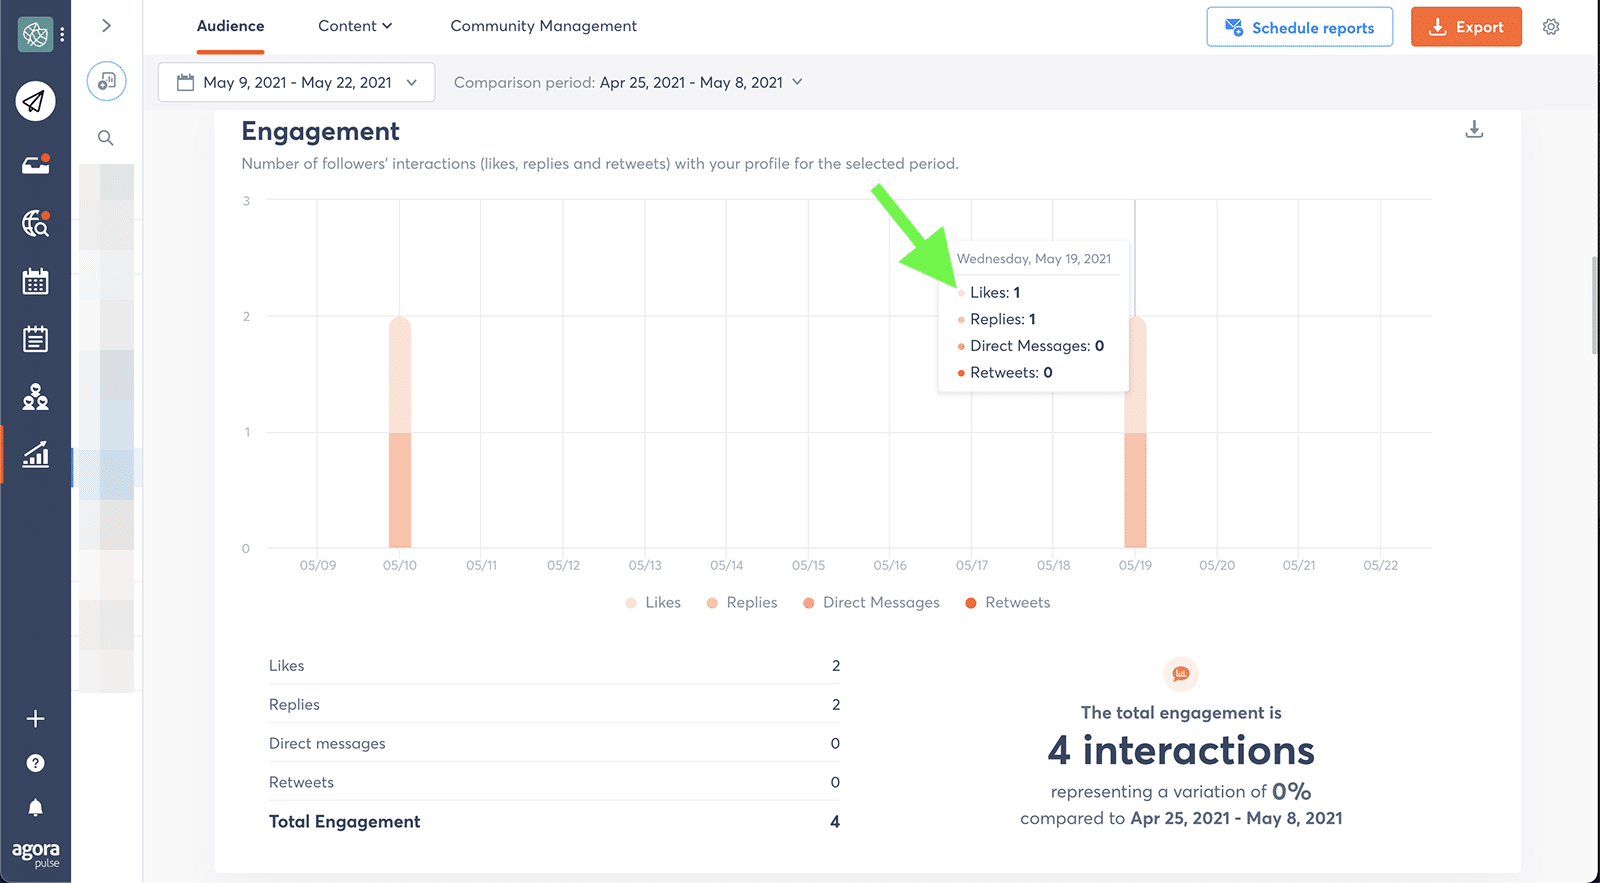
Navigate to the Agorapulse engagement report to review your profile’s likes. You can see the total number under the chart or hover over any date in question to get a daily breakdown.
Replies
Whether you call them replies or comments, these interactions reflect a higher level of engagement than likes. After all, replying to a tweet requires more effort than just a quick tap of the like button.
To get a look at the replies your profile received, check your Agorapulse engagement report. Are you curious which tweets prompted all those replies?
You can access a post-by-post breakdown in your content report (see below).
Direct messages
If your brand’s Twitter DMs are open, you can open the door to an entirely different level of engagement with prospects and customers.
Typically, DMs allow for more personal interactions, such as specific questions about a product or issues with an order. In some cases, your brand might even offer customer support via DMs.
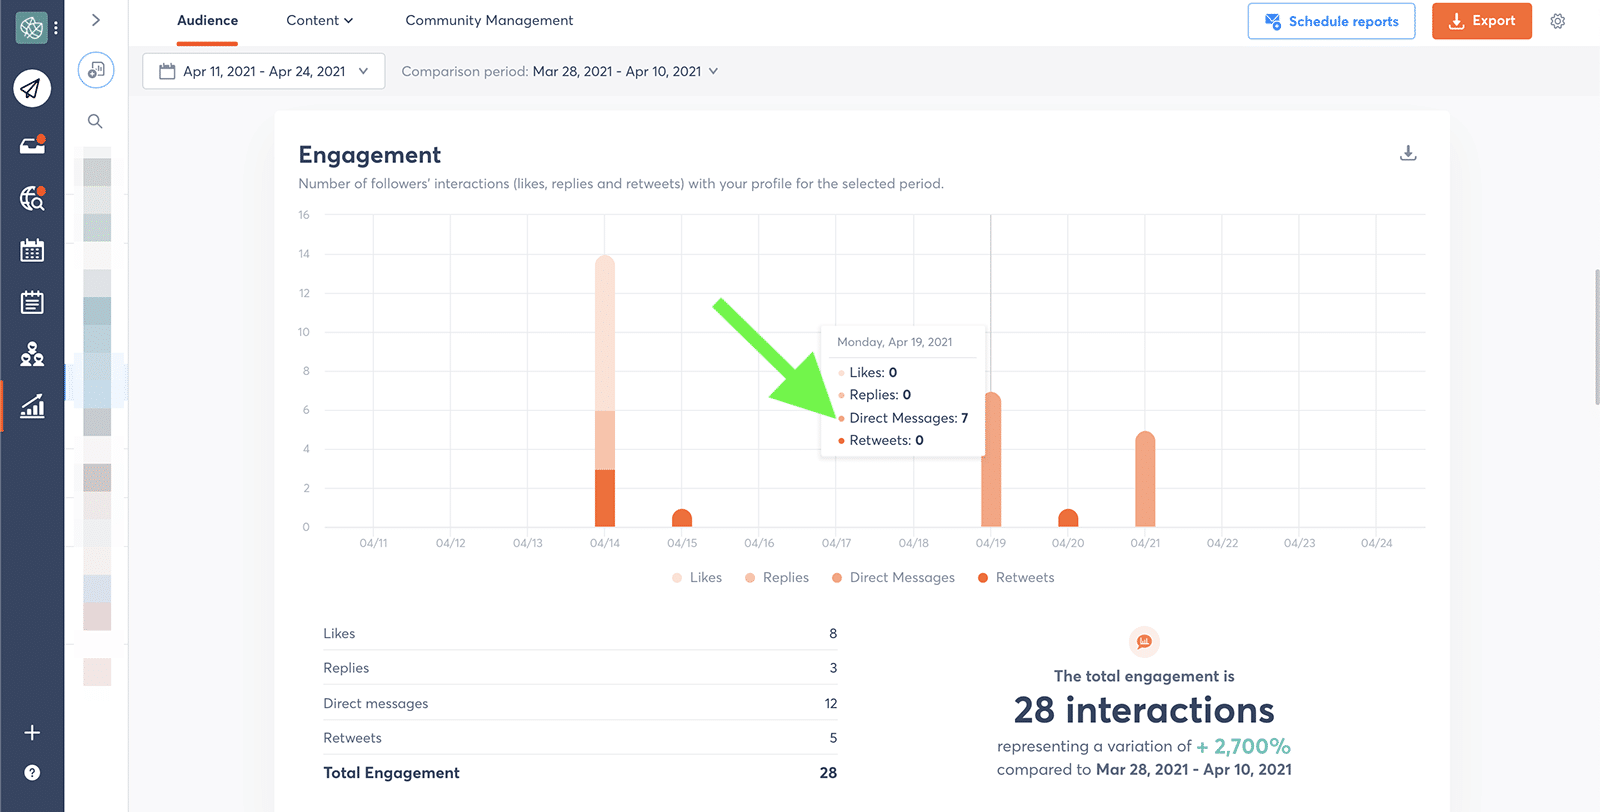
No matter how your team uses DMs, you can track them with Agorapulse’s engagement report. Click on any bar in the chart to see the daily breakdown.
Retweets
As Twitter’s version of shares, retweets indicate a show of support. After all, a retweet places your brand’s content directly on your audience members’ timelines, right where their followers can see and engage with your tweets.
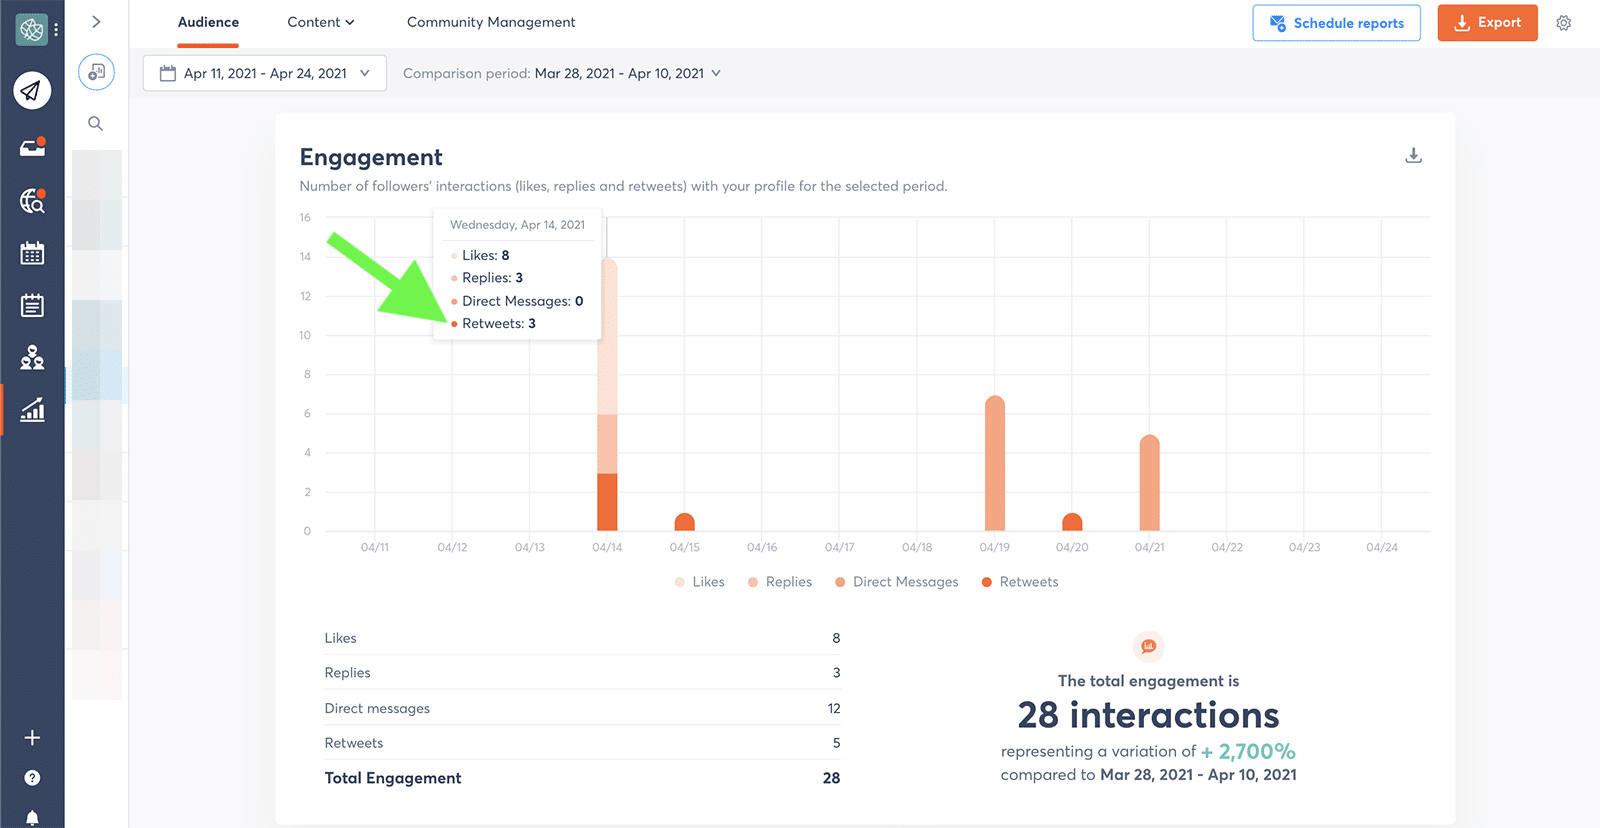
Like DMs, replies, and likes, retweets appear on Agorapulse’s color-coded engagement report.
You can also access detailed data for each tweet in your content report.
Tips for publishing social media content
Twitter Content Metrics
Monitoring engagement metrics over time is useful for making sure your tweets generate consistent views and interactions. Yet it’s just as important to know what drives all that exposure.
Agorapulse’s content reports have you covered.
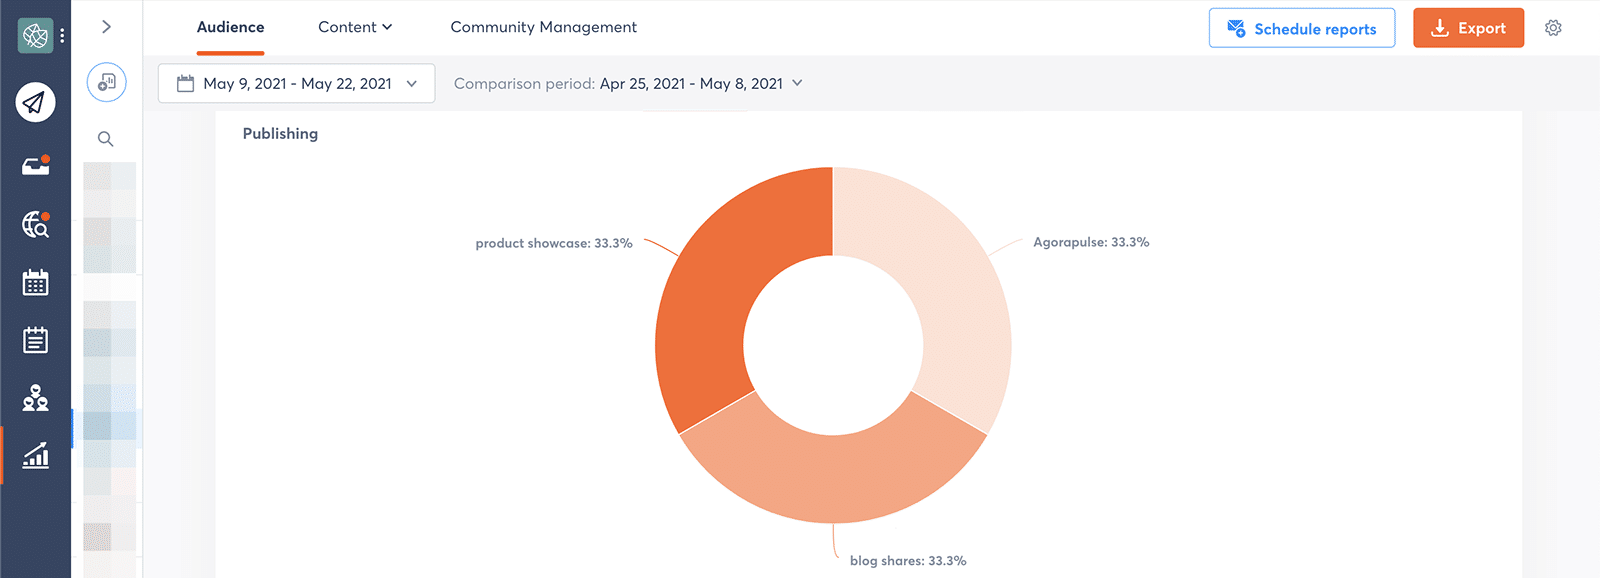
Publishing
How many times did you tweet during a particular time frame? How does that frequency compare to the previous period?
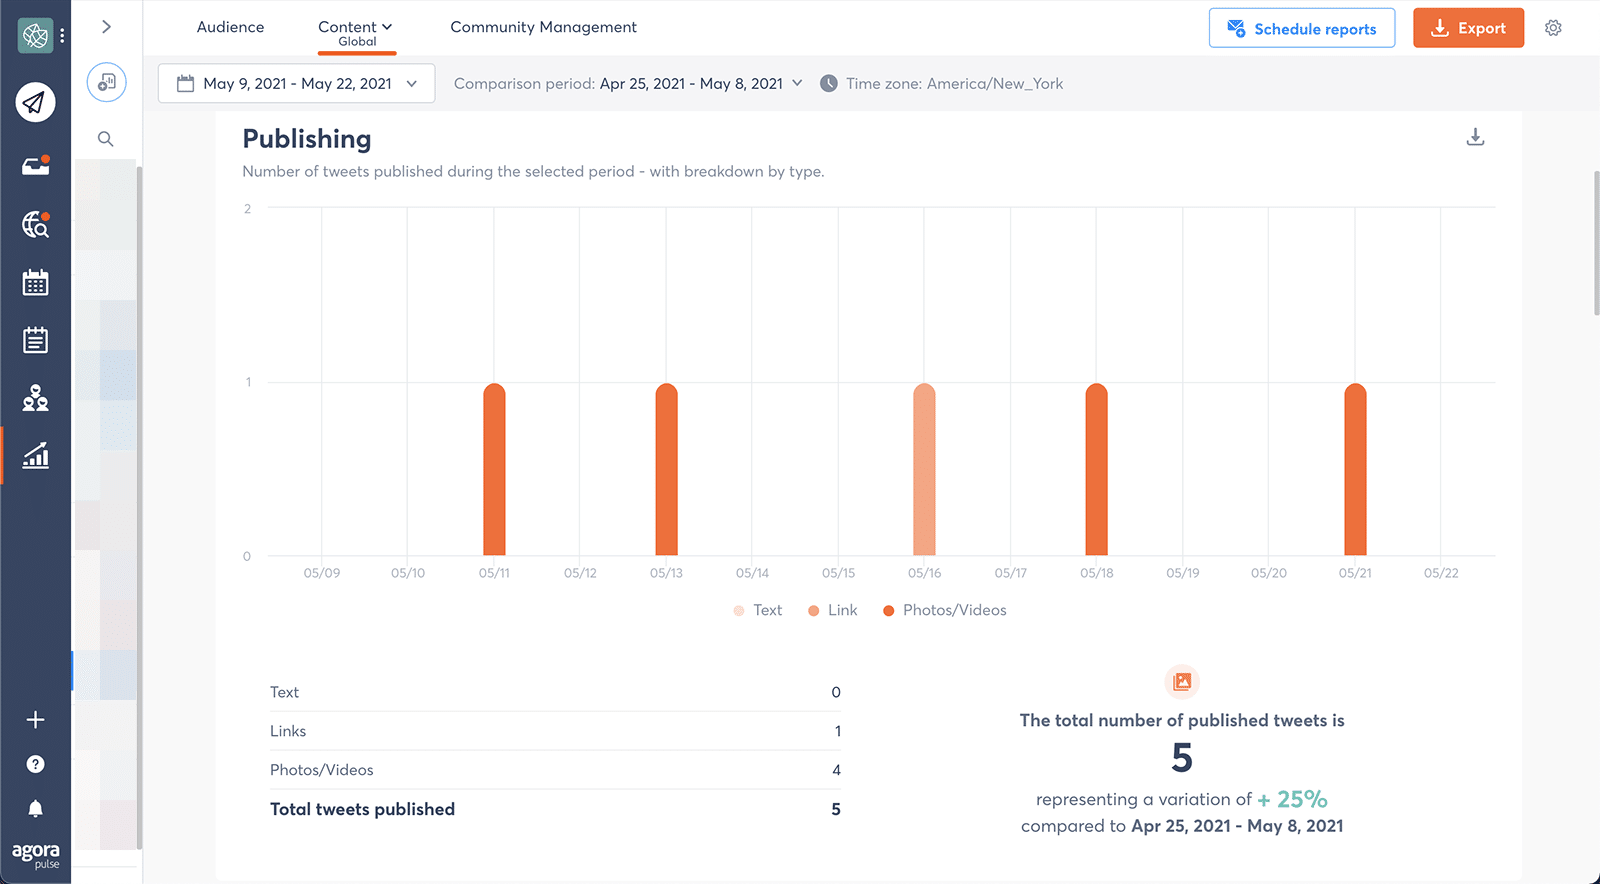
Navigate to Agorapulse’s content publishing report for a straightforward breakdown of what your brand tweeted and when. The chart gives you a quick overview of what you’ve tweeted from day to day.
You can see a helpful tally (below the chart) of the different types of content you’ve tweeted, including text, links, and photos/videos.
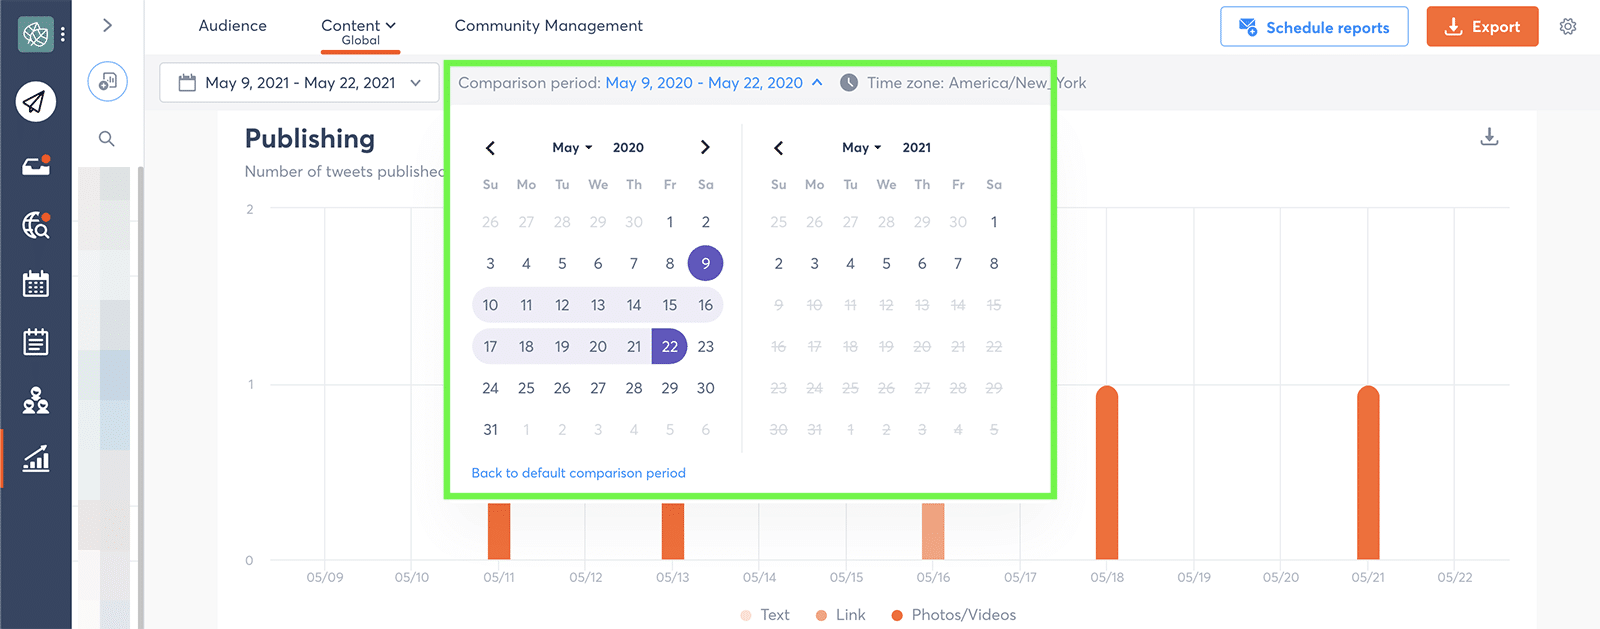
If you want to measure your publishing output against another time period, toggle the comparison period calendar. For example, you can compare to the same time frame during the previous year to see how your team’s priorities have changed.
Top content
Did your team post a hit tweet? When you identify the content that resonates best with your audience, it’s infinitely easier to produce more of what works–and then continue to generate great results.
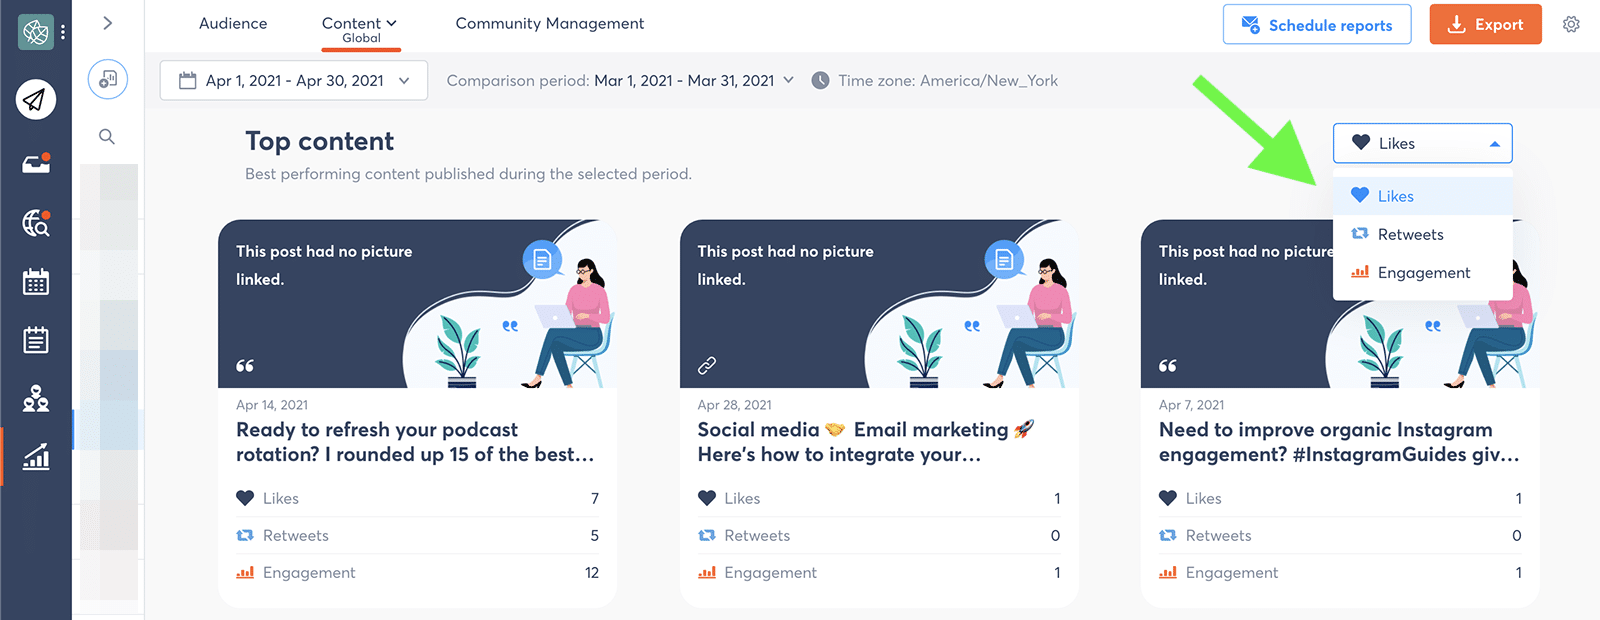
Agorapulse’s top content report displays the six best-performing tweets from the time frame you selected. By default, the report ranks your brand’s tweets by likes.
However, you can use the dropdown menu to rank top content by retweets or total engagement instead.
Content Performance
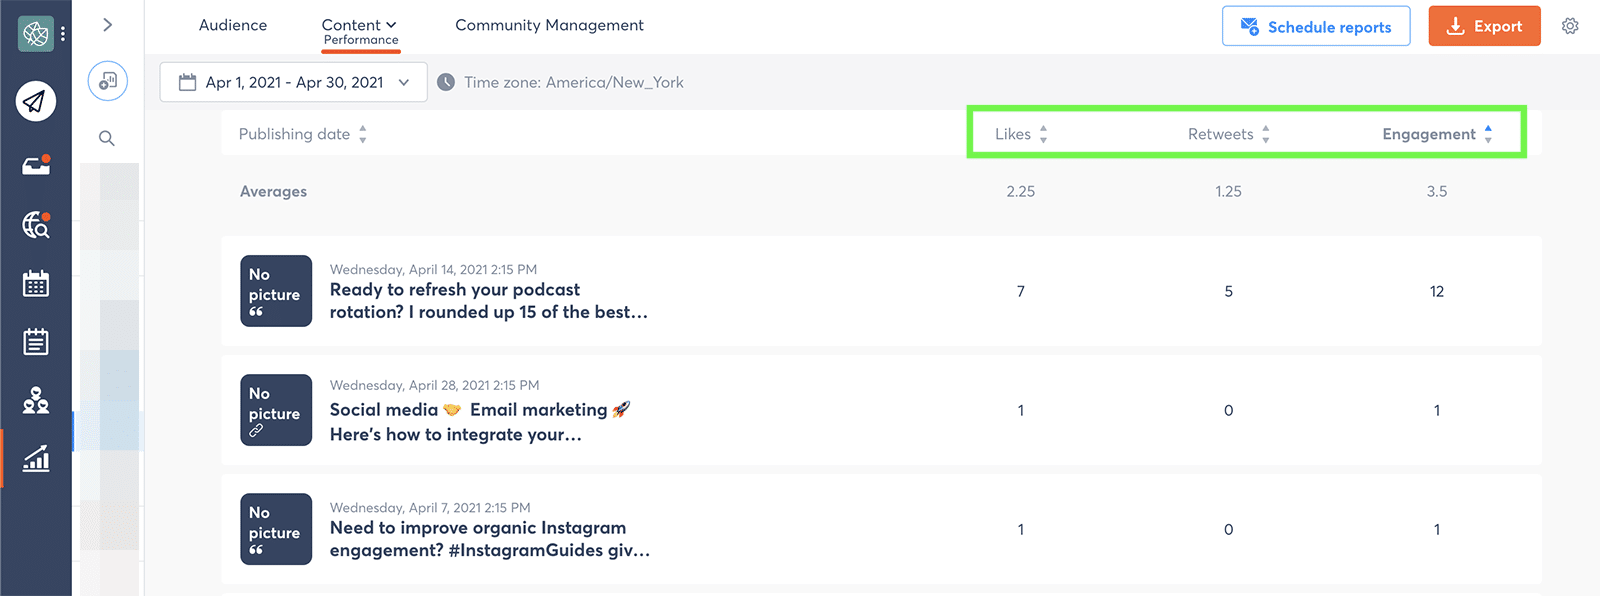
To review all the content your team tweeted during any time frame, navigate to Agorapulse’s content performance report. Toggle the metrics at the top of the chart to sort by likes, retweets, or total engagement.
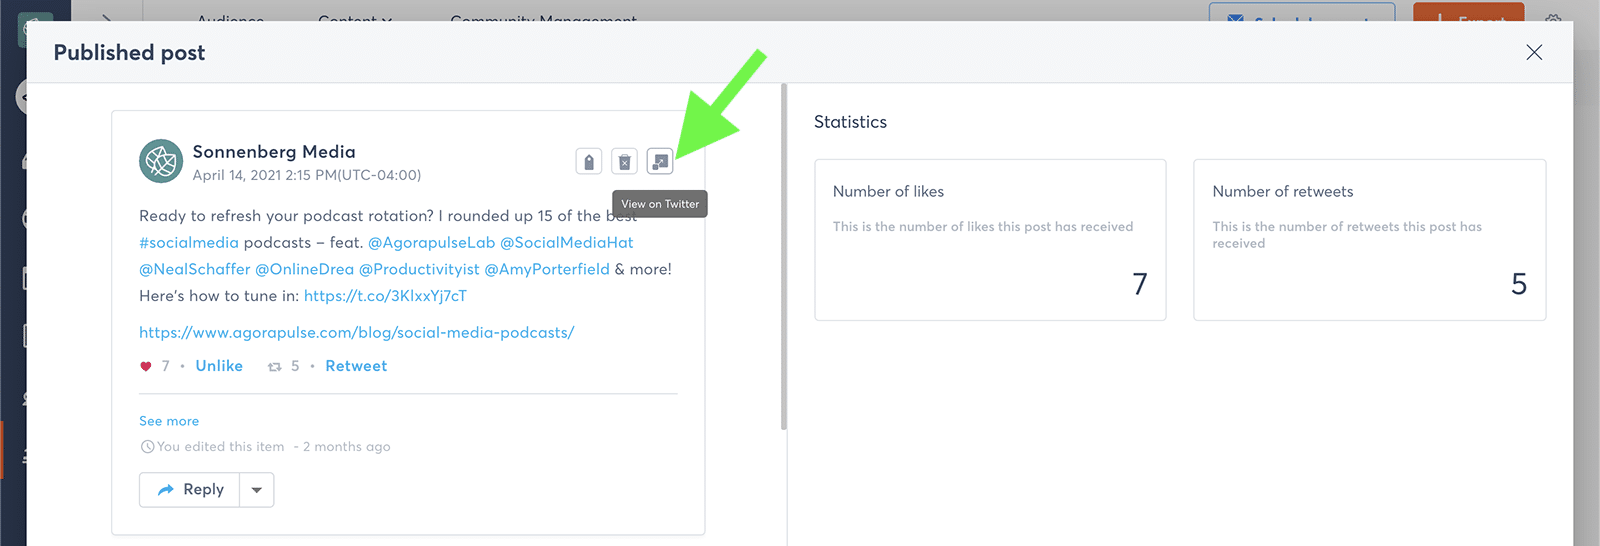
While the snippet doesn’t show the entire post, you can see the original tweet after a couple of clicks.
Tap on any post in the chart to see a preview and the complete engagement metrics. Then click the View on Twitter button to go right to the original tweet.
Twitter recommendations
If you had tons of time on your hands, your team could spend hours crunching numbers and analyzing data to determine what to post when. Alternatively, you could save time and use Agorapulse’s recommendations for what and when to tweet.
Best day and time to publish
Twitter timelines are never-ending streams of new information. They update constantly.
The half-life of a tweet is a measly 20 minutes. That means Twitter content receives half of its total lifetime engagement in less than a half-hour, so timing your tweets right is critical.
So when should your brand tweet? Most recommendations for the best times to tweet are based on data from across industries. While that provides a good baseline, it doesn’t take into account what’s optimal for your brand.
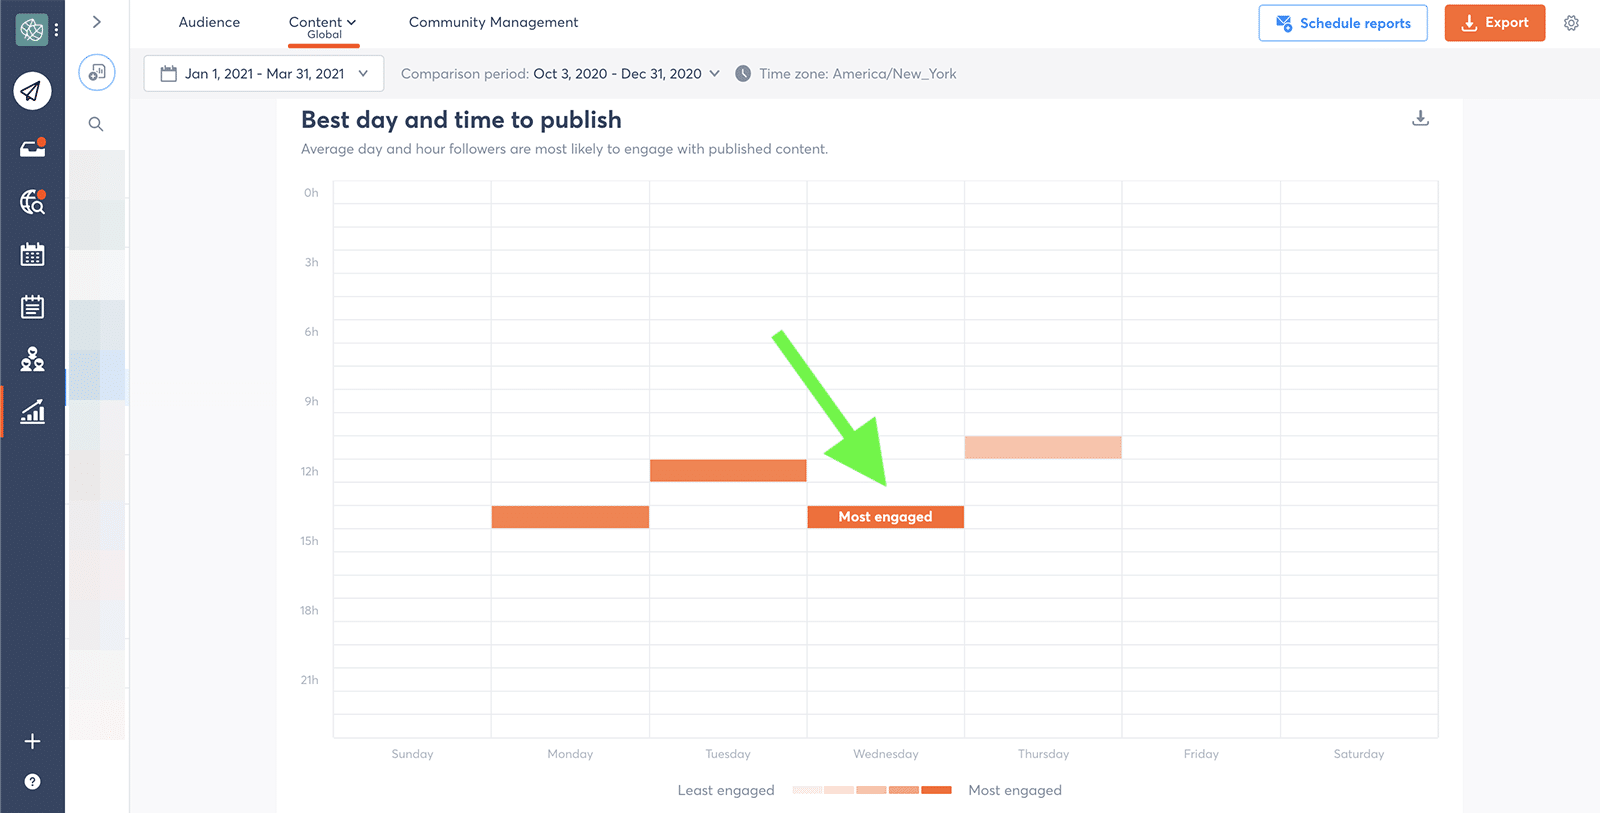
Fortunately, you never have to guess when is the best time to tweet.
Agorapulse’s content report shows you exactly what day and time users are most engaged with your tweets. You can incorporate these times into your team’s publishing schedule or you can view them as more of a guide and do a little experimenting of your own.
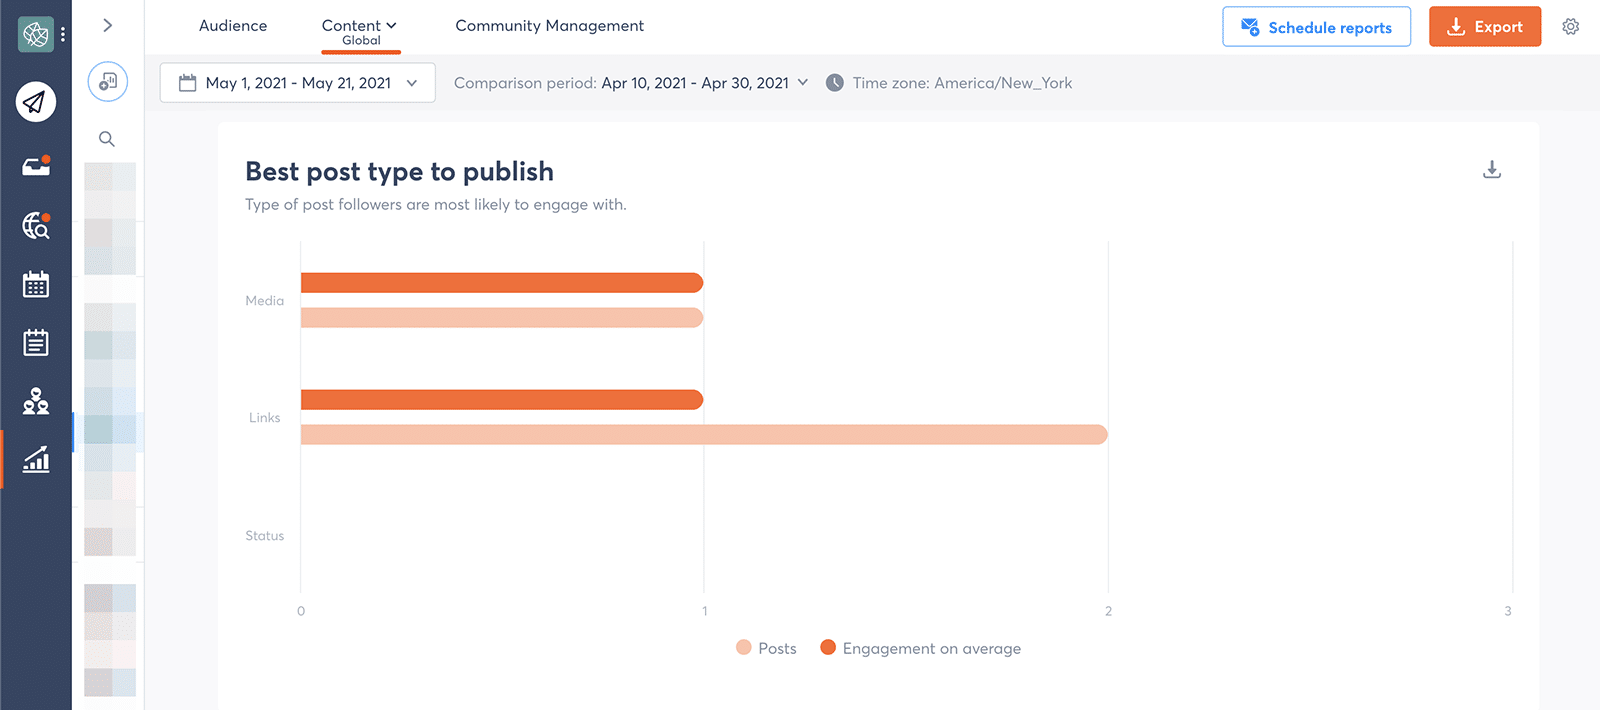
Best type of content to publish
Now you know when to publish. But what about what to tweet? Agorapulse doesn’t tag your tweets automatically, but you can set up some simple rules to streamline the process.
If you already categorize or color-code your Twitter content calendar, this part will be easy.
Just take the tags or categories from your content calendar and add them to your list of publishing labels in Agorapulse. Then use these labels to tag everything you tweet via Agorapulse.
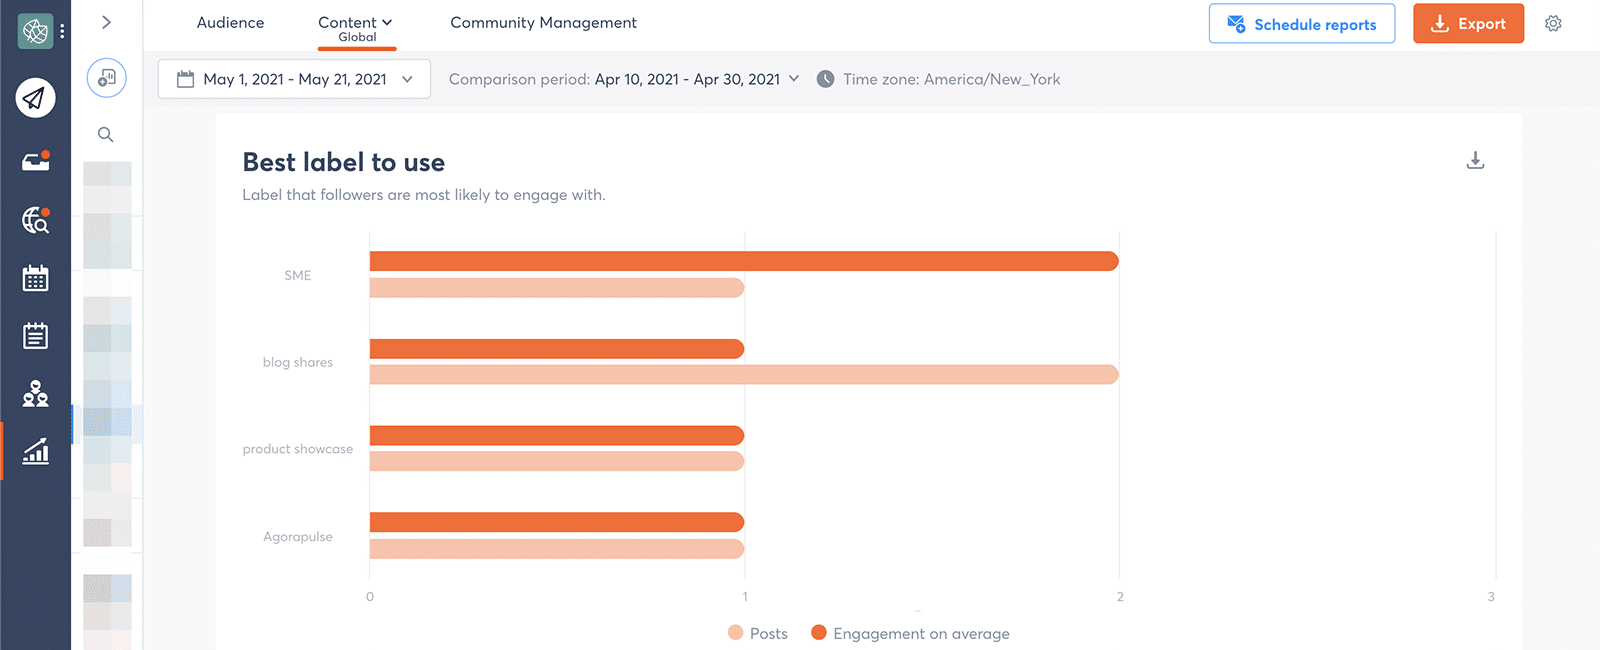
Go back to your Twitter content report, and check the recommended labels.
Which labels generate the most engagement? Keep these recommendations in mind as you plan upcoming tweets and brainstorm campaigns.
Hashtags and Interactions
Using hashtags can help you gain valuable traction on Twitter, but you have to know which ones to use. Hashtag tools can help you find trending terms and check popularity levels before tweeting.
After tweeting, it’s essential to keep track of performance.
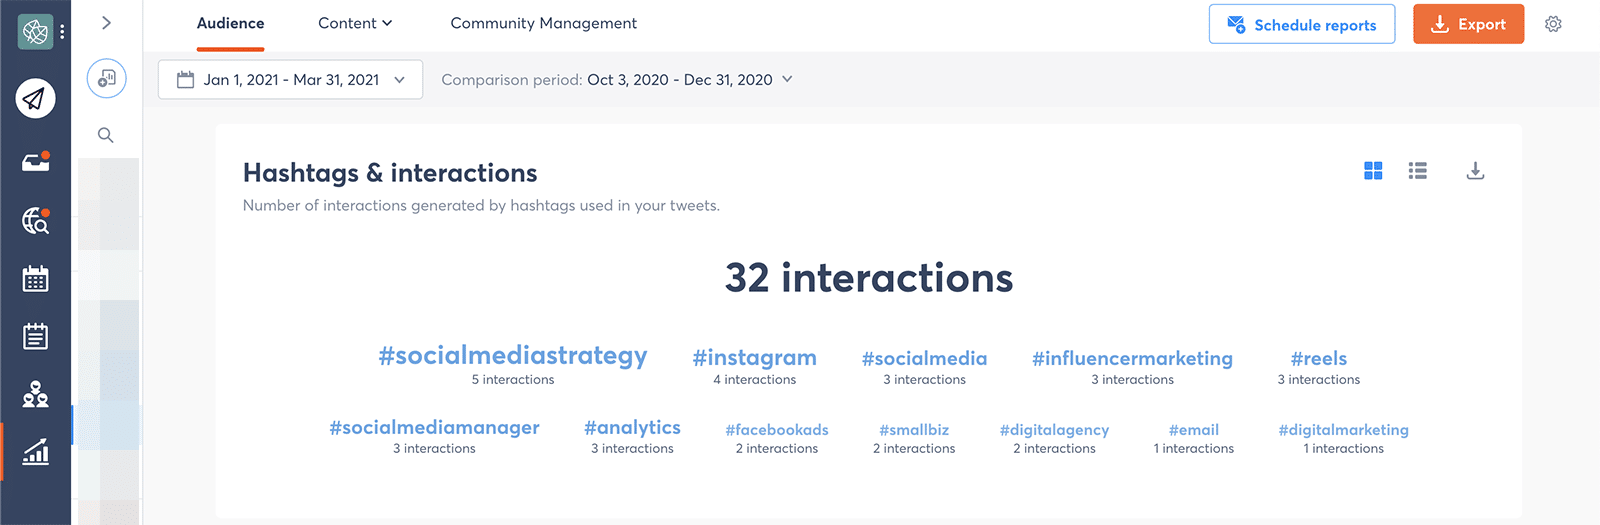
Agorapulse automatically tracks all the hashtags you use, displaying your top 30 from any time frame in a cloud formation. The hashtags that generated the most interaction stand out with a larger font so you can spot top performers quickly.
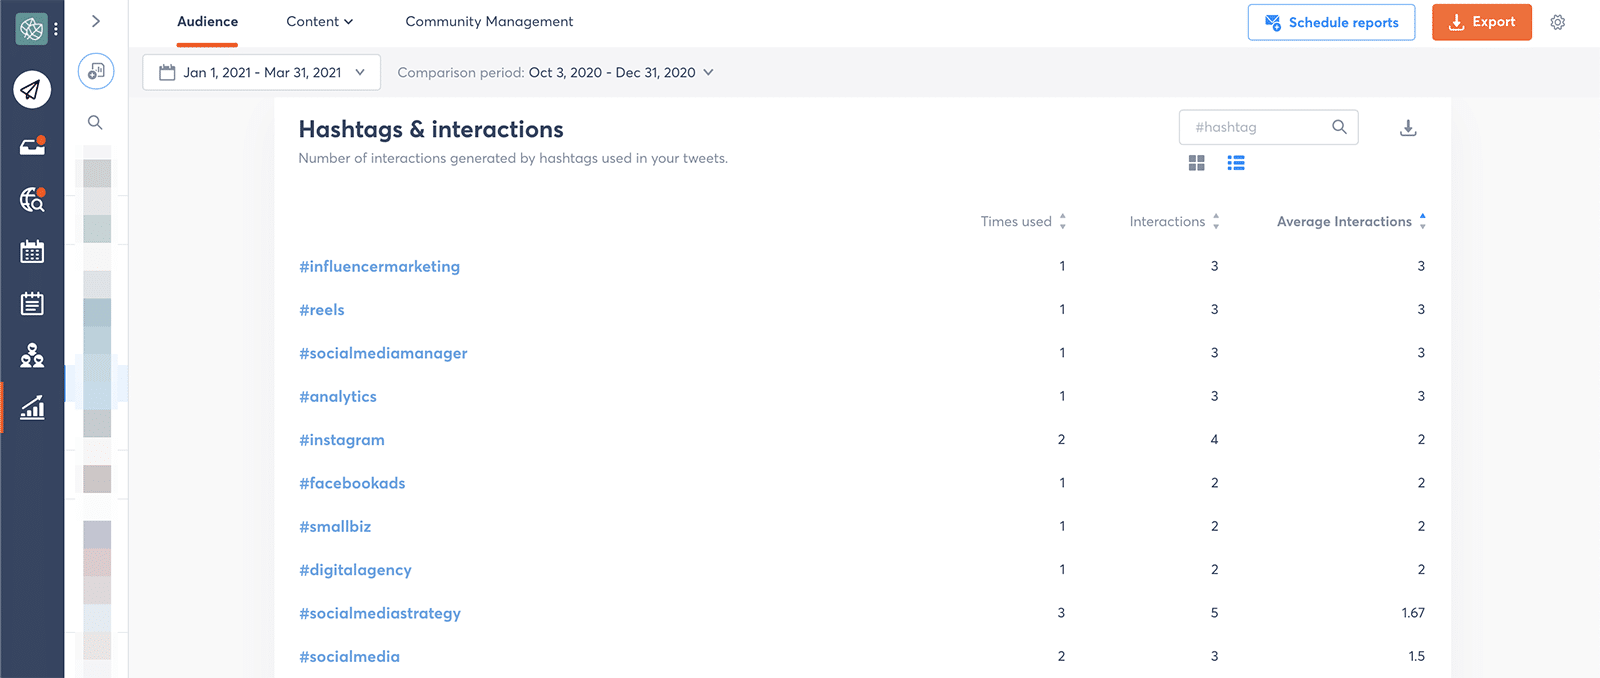
If you switch to list view, you can get a complete catalog of the hashtags your team tweeted. Sort by Times used to pick out the ones you tweet regularly, or sort by Interactions to find the ones that work the hardest.
You can also sort by Average interactions to pinpoint the hashtags that contribute the greatest value.
Social Listening Metrics
If you check your Twitter notifications frequently, you may easily assume that you already know every time someone mentions your brand on Twitter.
But what if they don’t @ your brand? Or what if they misspell your company’s name or just mention your product name instead?
With social listening, you can catch all of these mentions, even if they’re not direct. This type of brand monitoring lets you listen in on conversations and find out what customers, competitors, and industry figures are saying about your brand or the market as a whole.
With Agorapulse, you can simplify social listening, no matter what you want to monitor.
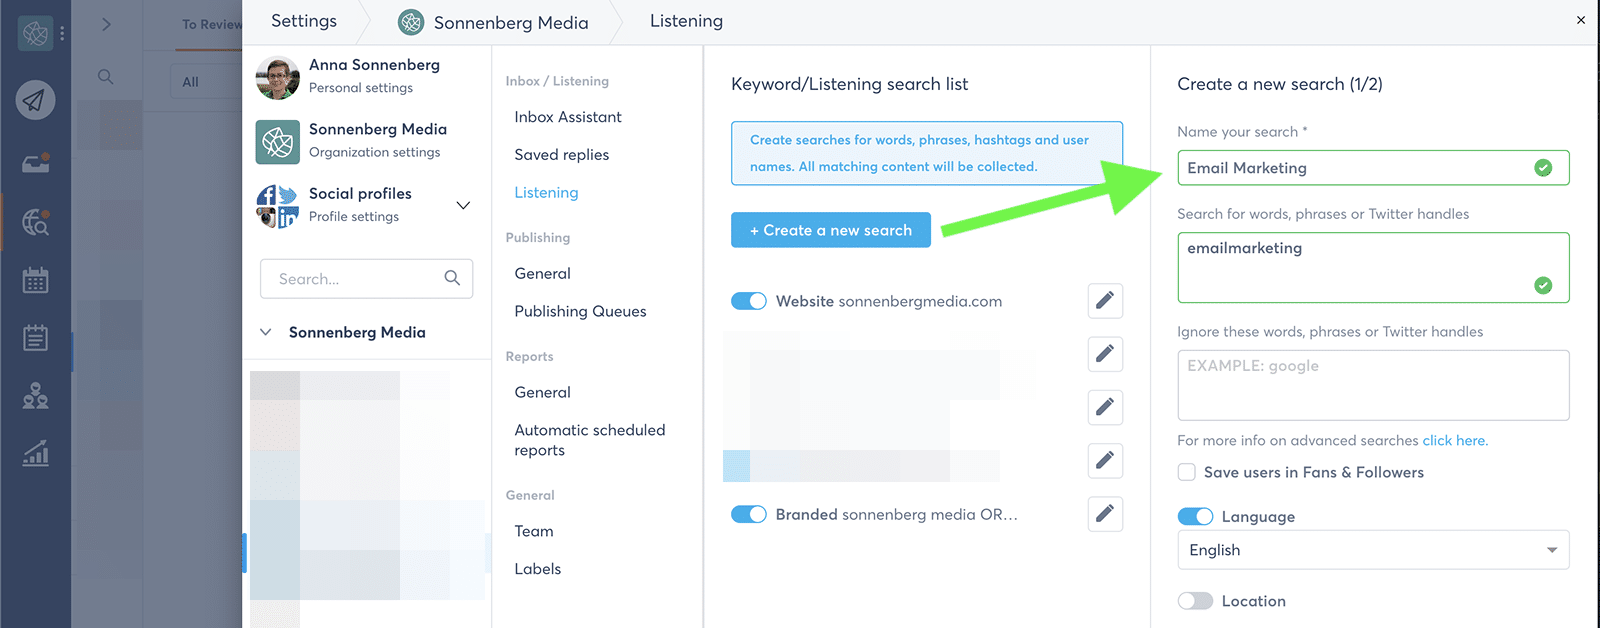
Start by adding the terms you want to track as social listening searches. You can include anything from your company’s products and services to competitors’ Twitter handles. Relevant tweets will start to appear in your social listening inbox.
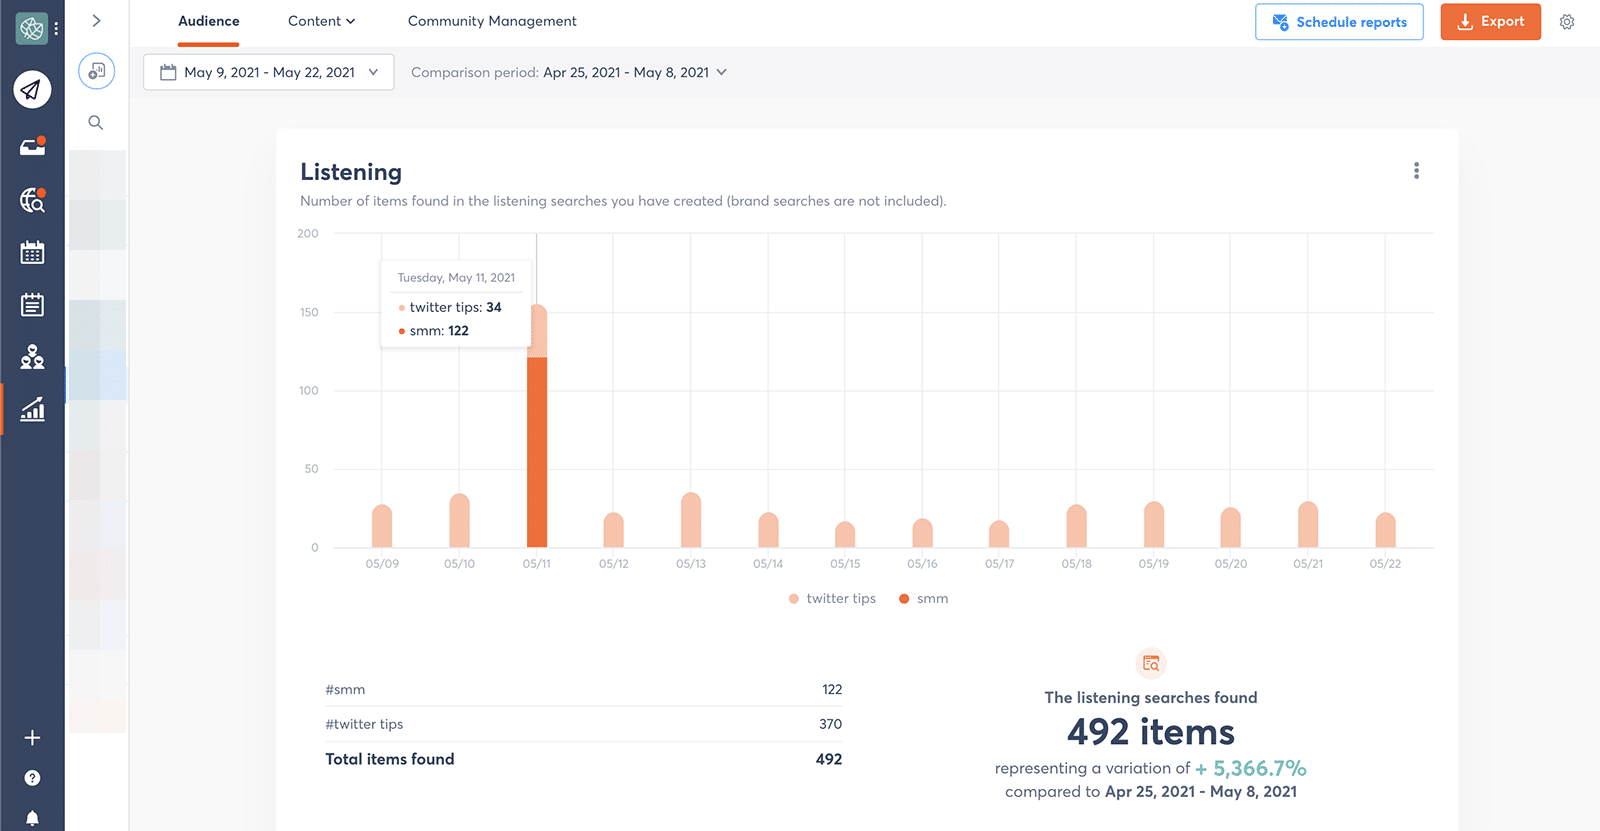
Then navigate to your listening report to monitor your searches. The chart tracks your searches over time, making it easy to see spikes in activity. Agorapulse also tallies the totals for each search so you don’t have to do the math.
Brand Awareness Score
So what’s the story? Are people really talking about your brand, or was your team just hearing things? Keeping track of your brand awareness score is an easy way to track your impact objectively.
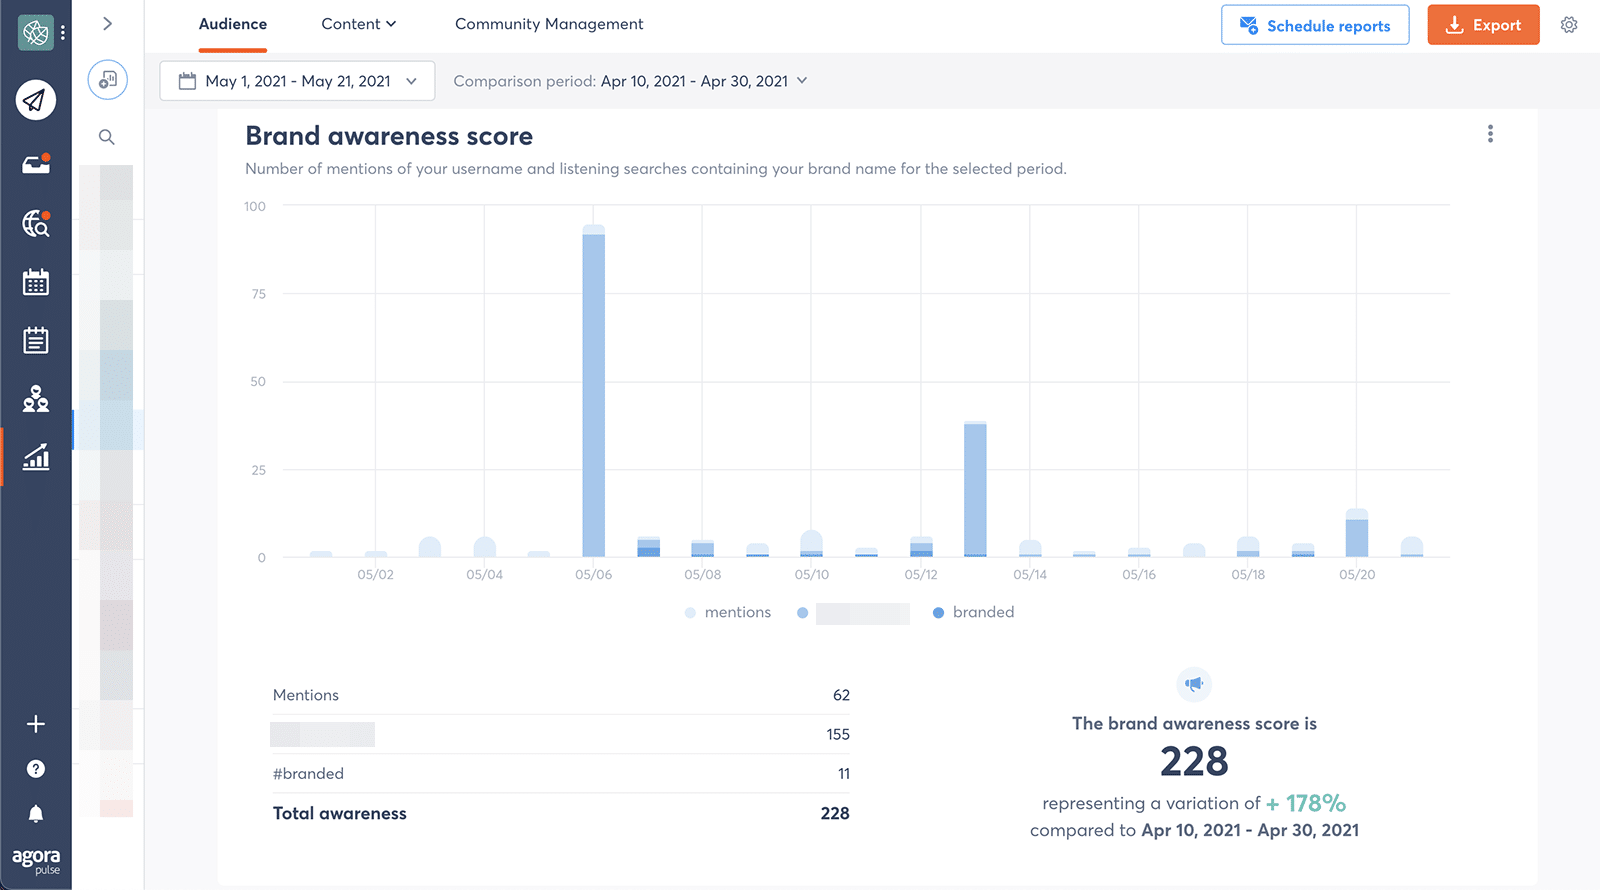
Agorapulse automatically adds all your brand mentions to the score, but you can add more input as necessary. When you set up a listening search, check the Save users in Fans & Followers box to incorporate the results into your brand awareness score.
For example, you might want to add product or service names or campaign hashtags to provide a more complete picture of your company’s current brand awareness score.
Be sure to pay attention to Agorapulse’s automated comparison. It can help you track brand awareness over time or from year to year, so you can keep an eye on trends and make sure you’re moving things in the right direction.
Tips for Agencies
With its fast-paced format, Twitter can easily keep an entire social media management team busy. If your agency manages several clients’ Twitter accounts, then it’s even more important to set up time-saving workflows.
Follow these tips to make it easier to juggle additional Twitter metrics.
Label everything
When you use Agorapulse for social media management, you can label anything that lands in your brand’s social or listening inbox or any item your team publishes.
Though it’s true that labels help with organization, they’re even better for monitoring metrics.
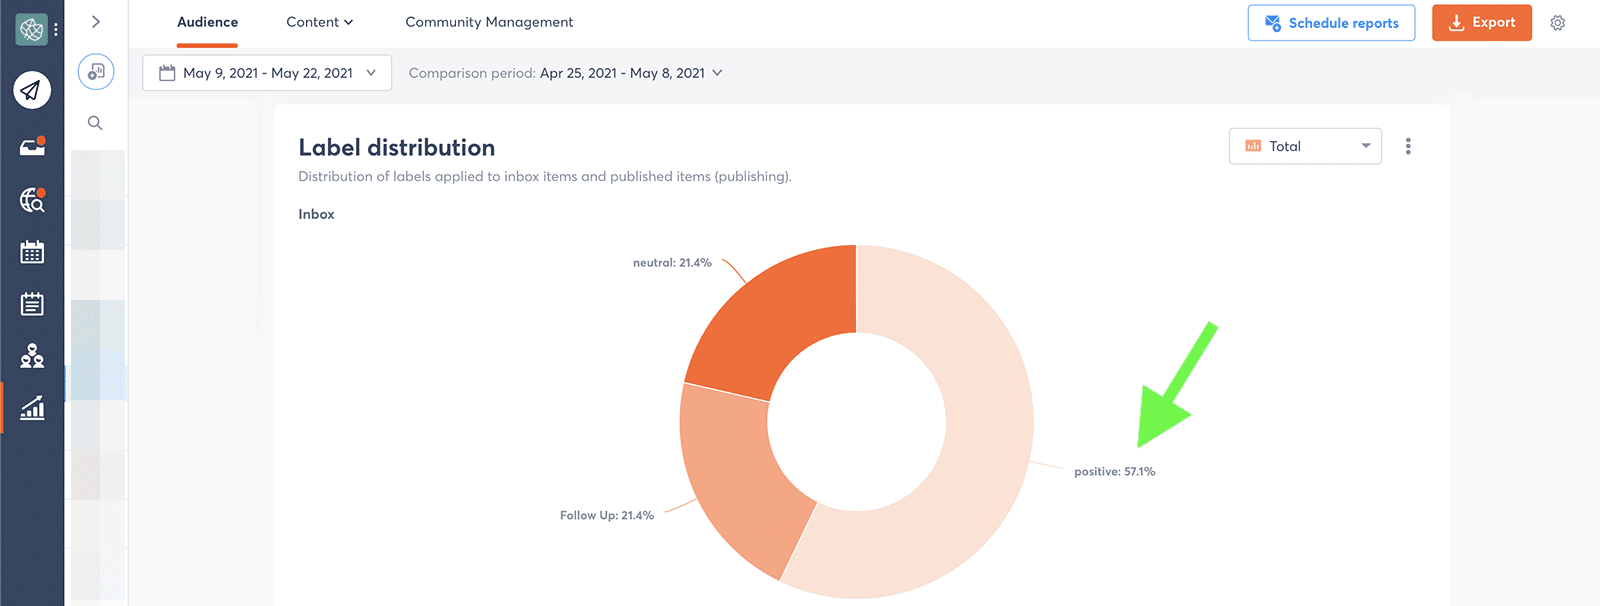
When you label inbox items, you can keep track of customer sentiment automatically.
After reviewing social inbox items, give them a label like happy or frustrated. Then use Agorapulse’s label distribution report to track the percentage of each. If your clients receive tons of DMs and replies, you can even set up rules to apply labels automatically based on keywords.
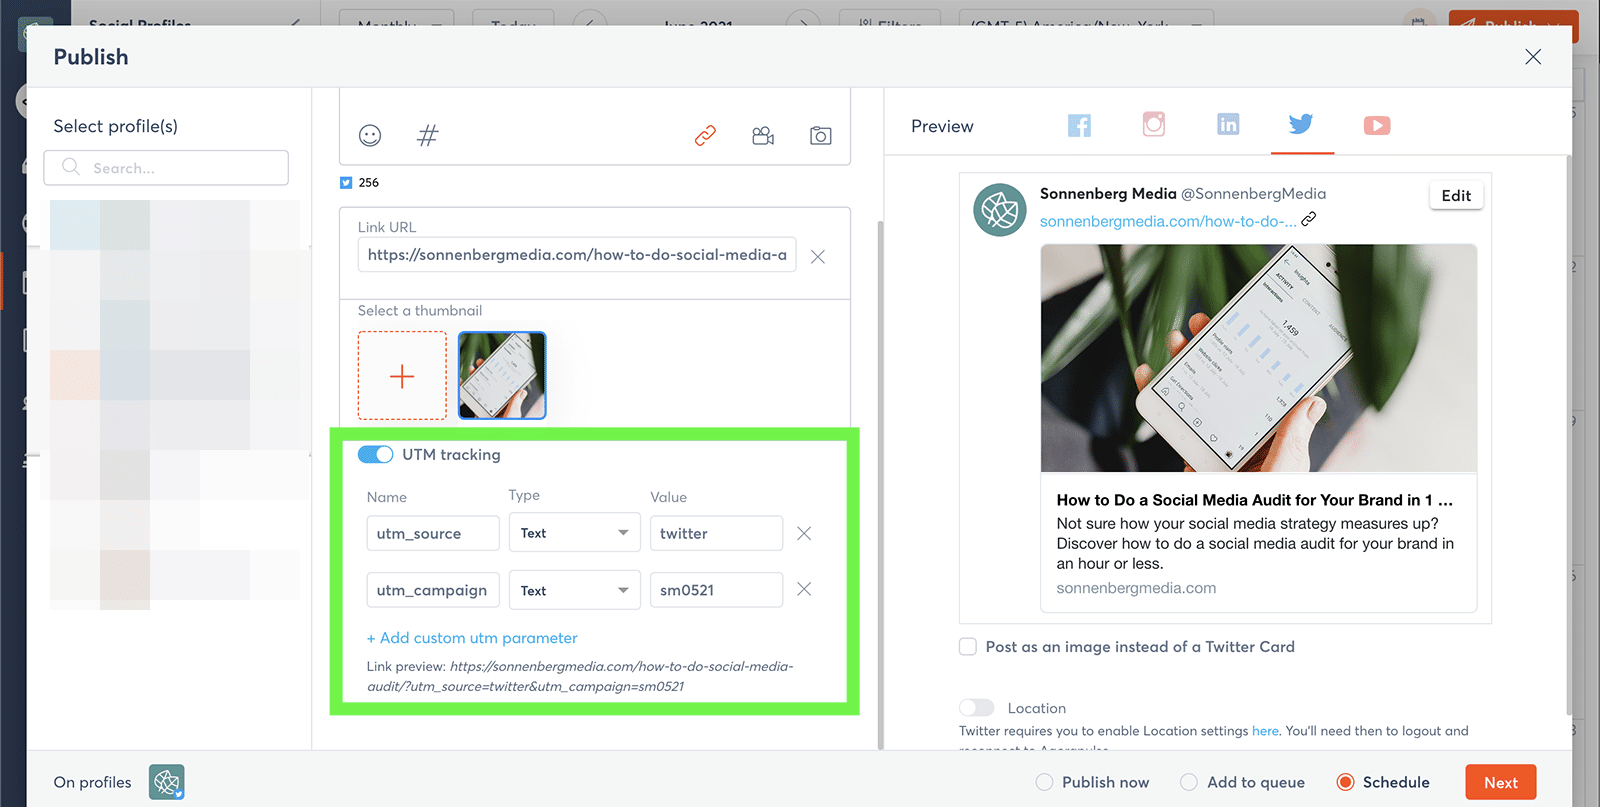
Track Twitter conversions
If you tweet a lot of links to your company’s website, you’ll want to monitor what happens after users click through. When publishing content with Agorapulse, set up UTM parameters to tag your campaigns automatically.
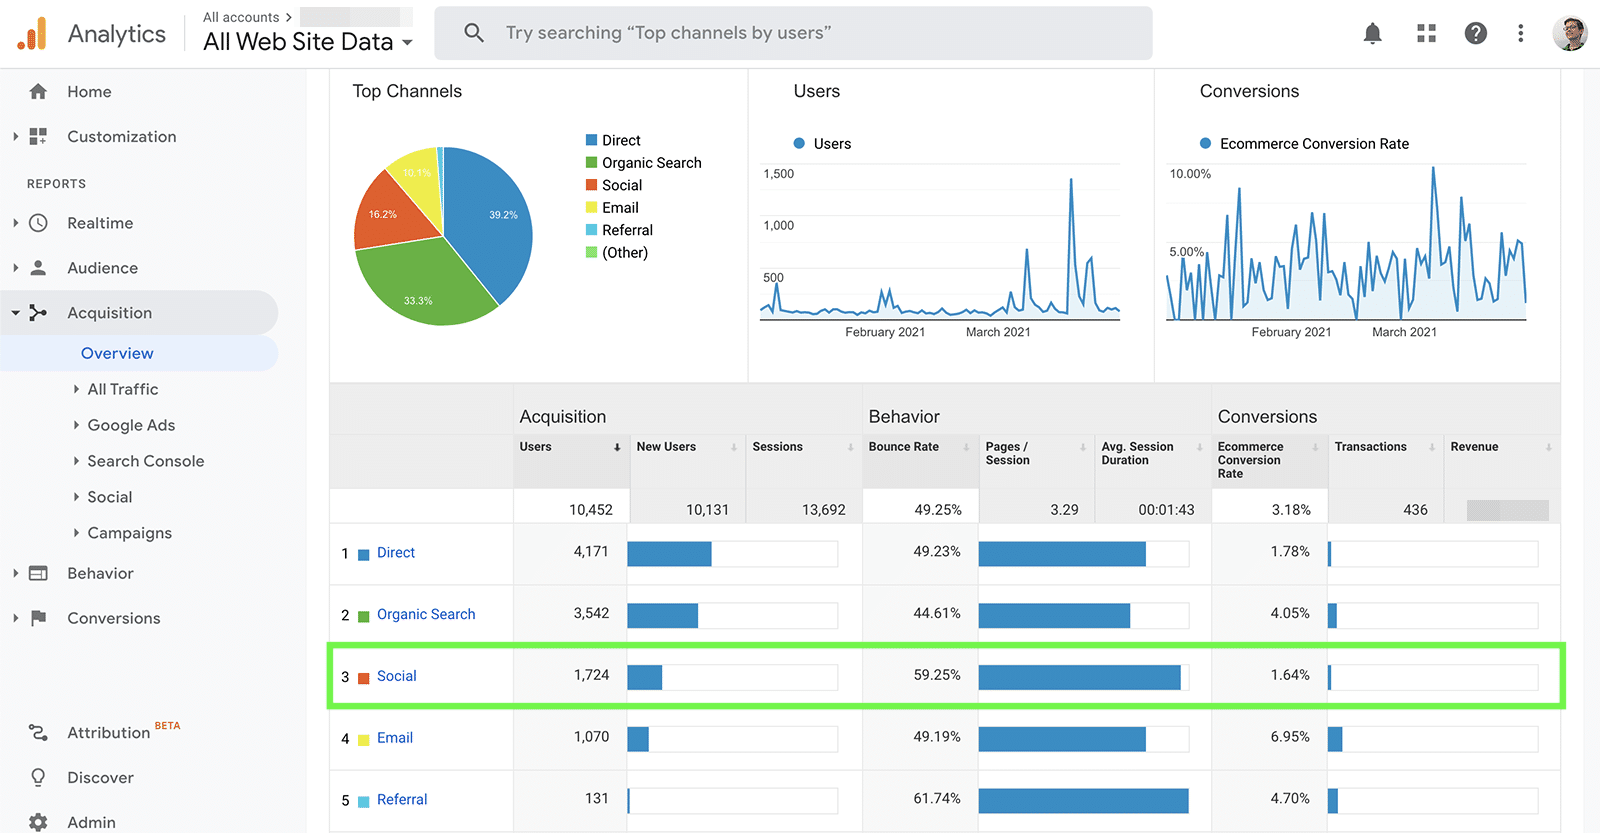
Then use Google Analytics to track user behaviors. Depending on your website setup, you can monitor e-commerce conversions, lead form submissions, or email subscriptions.
You can also track which pages Twitter users visit so you can get a better idea of their interests and where they are in the buyer’s journey.
Create comprehensive reports
Does your agency handle more than just Twitter accounts? You can compile all your social media reports under a single cover to reduce downloads and related confusion.
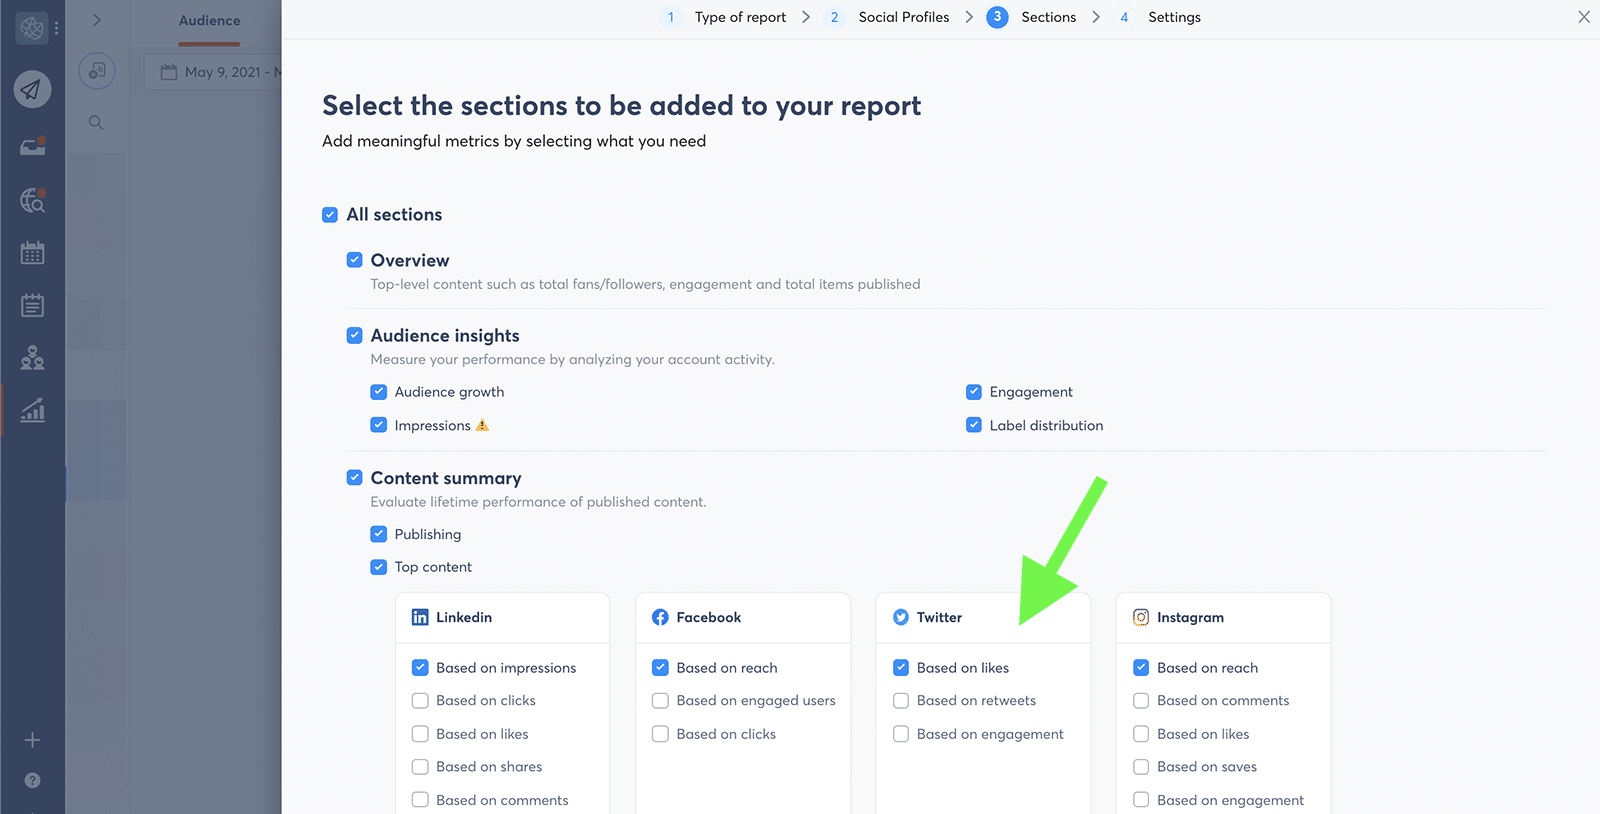
Start by creating a new custom report with Agorapulse.
Add the client’s social media profiles, and then select the data you’d like to include. Be sure to choose how you want the report to determine top content, so you can show each client what they want to see.
Automate reporting
To save even more time, switch on automated reporting for any custom or individual Agorapulse report. You can opt for weekly or monthly frequency to meet client expectations.
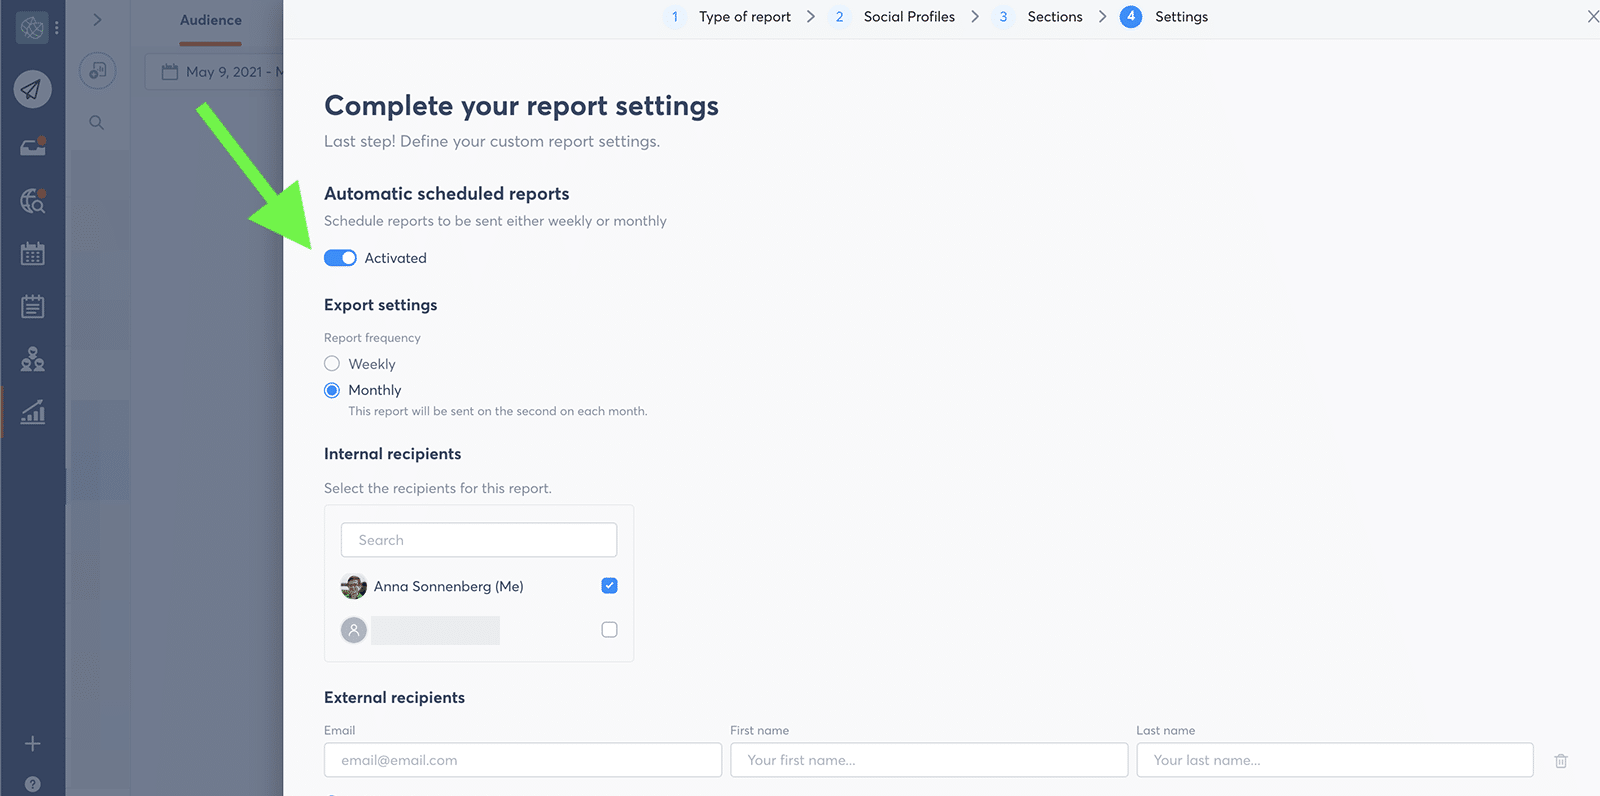
Choose which team members should receive the report or add external client emails. If you’d rather review the report before distributing it, send it to yourself only. Then add your analysis to the report before sending it along to other stakeholders.
In Conclusion
The Twitter metrics that matter most to your brand might be a bit different from the ones your competitors prioritize.
But by tracking key metrics and monitoring progress over time, your team can make sure your Twitter strategy is on the right path to achieve major marketing goals and drive measurable value for your brand.
Take control of your social media right now! Check out our free trial of Agorapulse to help you schedule, track, and measure all your social media efforts.


