

Whether you’re building an Instagram profile from the ground up or you run a hugely successful account, you know you have to keep track of your team’s progress.
But which Instagram metrics are most important? Which metrics offer the best insights?
Let’s look at the Instagram metrics that matter most for your social media marketing goals.
Why Do These Instagram Metrics Matter?
Instagram metrics offer important insights. Tracking them can help your team improve in several key ways.
Monitoring Instagram metrics (real metrics, not vanity metrics) matters because they let your team:
- Find out what’s working. Whether you’re concerned about engagement, conversions, or other signs of success, tracking metrics helps you learn what drives the results you want.
- Identify what’s not doing well. When content doesn’t perform as well as you’d hoped, monitoring metrics can help you pinpoint the problem quickly. Then you can adjust your Instagram strategy going forward to get the results you want to see.
- Allocate resources appropriately. When you identify what works and what doesn’t, you can get a better sense of where to spend your team’s budget. For example, you might want to produce more videos or plan more professional photoshoots.
- Understand the value of your work. What value does your team place on likes, comments, social referrals, or conversions? By monitoring metrics, you can collect the data you need to place a value on your Instagram results.
Instagram Audience Growth
Account growth is a sign of success for just about any brand on Instagram.
But audience growth is much more than the final tally at the end of the week or month. Ideally, you want your audience to grow steadily over time, indicating a healthy increase in brand awareness.
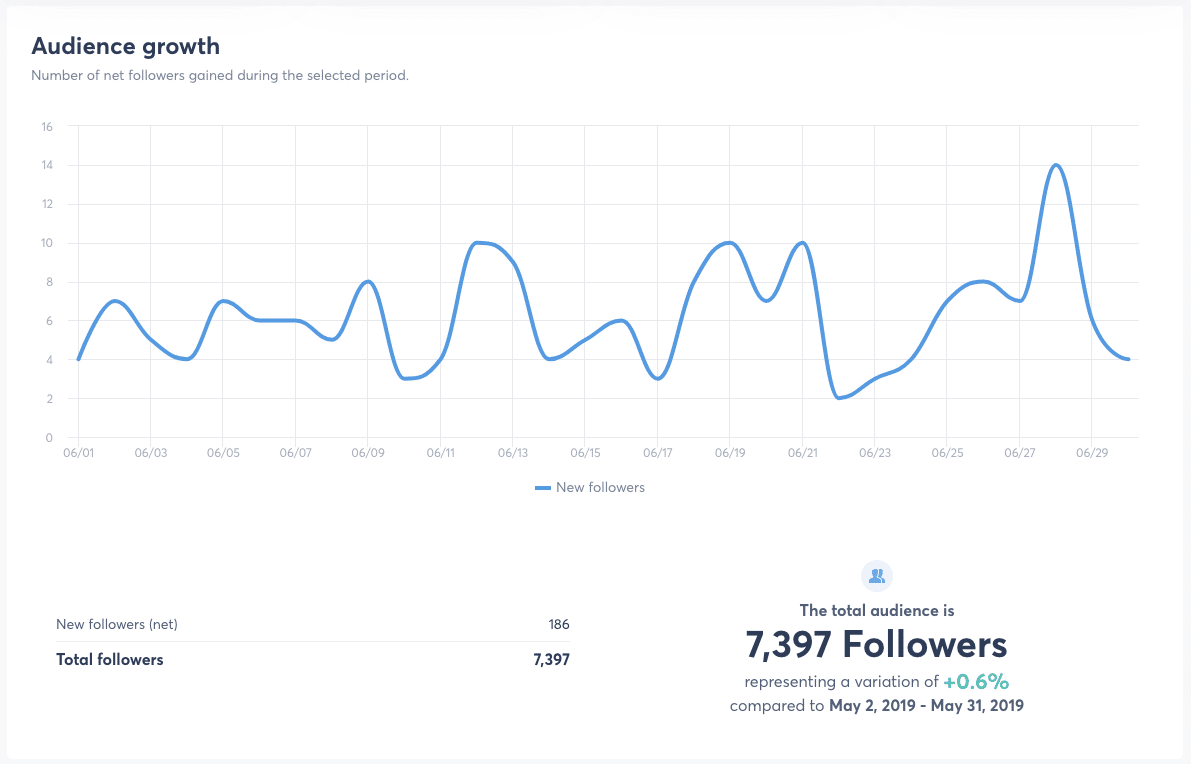 You can easily track total account growth with Agorapulse’s audience report.
The chart shows the total size of your audience over time so you can make sure things are moving along at a steady clip.
You can also see if your account has hit a plateau and stopped gaining momentum. If so, you can develop a social media strategy to address that if necessary.
For a more granular look at your account growth, toggle the menu and review the variation in your audience over time.
That chart shows the number of followers you gained each day. What days did you gain the most followers? Did your team post particularly amazing content that day? Can you replicate the results?
Grab these content ideas if you’re creatively blocked
Instagram Audience Demographics
Every marketing manager wants to build a big Instagram account. However, not just any followers will do.
Instead, you want to make sure the audience you’re attracting is aligned with your brand and your target customer. (If it isn’t, it might be time to rethink either your target market or your Instagram marketing strategy.)
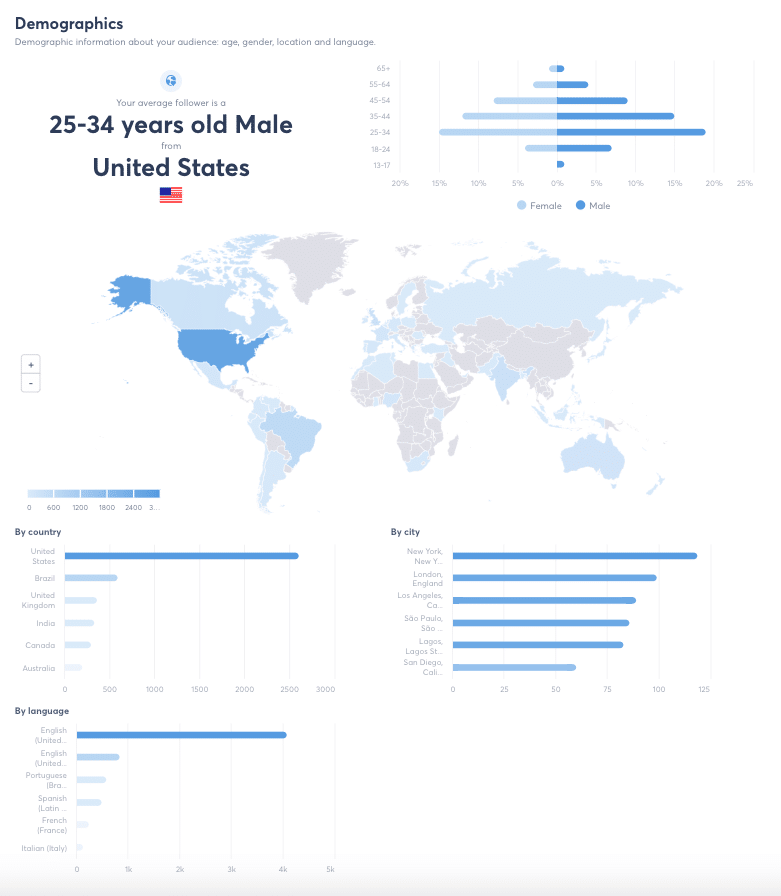
To access Agorapulse’s demographic data, scroll to the bottom of the audience report. You can see an age- and gender-based breakdown of your audience along with a map that highlights where your audience is from.
Scroll a bit further to see a city-by-city breakdown for your audience. If your brand appeals to a local audience, this is a great way to make sure you’re actually reaching people in your local area.
Instagram Reach
How many people are seeing the content your team posts on Instagram every day, week, or month?
Although attracting more followers is a great sign of growth, you want to make sure people are actually taking a look at your content.
After all, you want your audience to follow along with the story you tell and check out your promotions.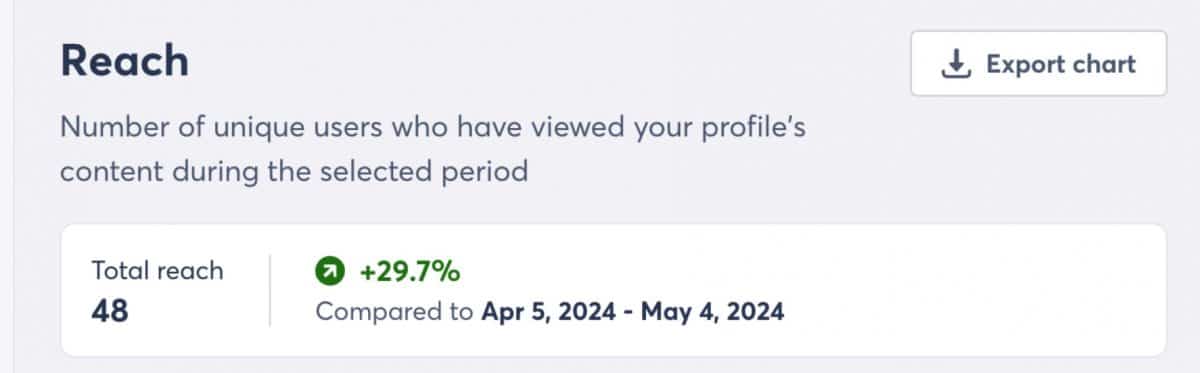
By tracking reach, you can monitor how many people see your content in a given time period.
Then you can make sure it follows a steady upward trend over time–or you can pinpoint unusual highs or lows.
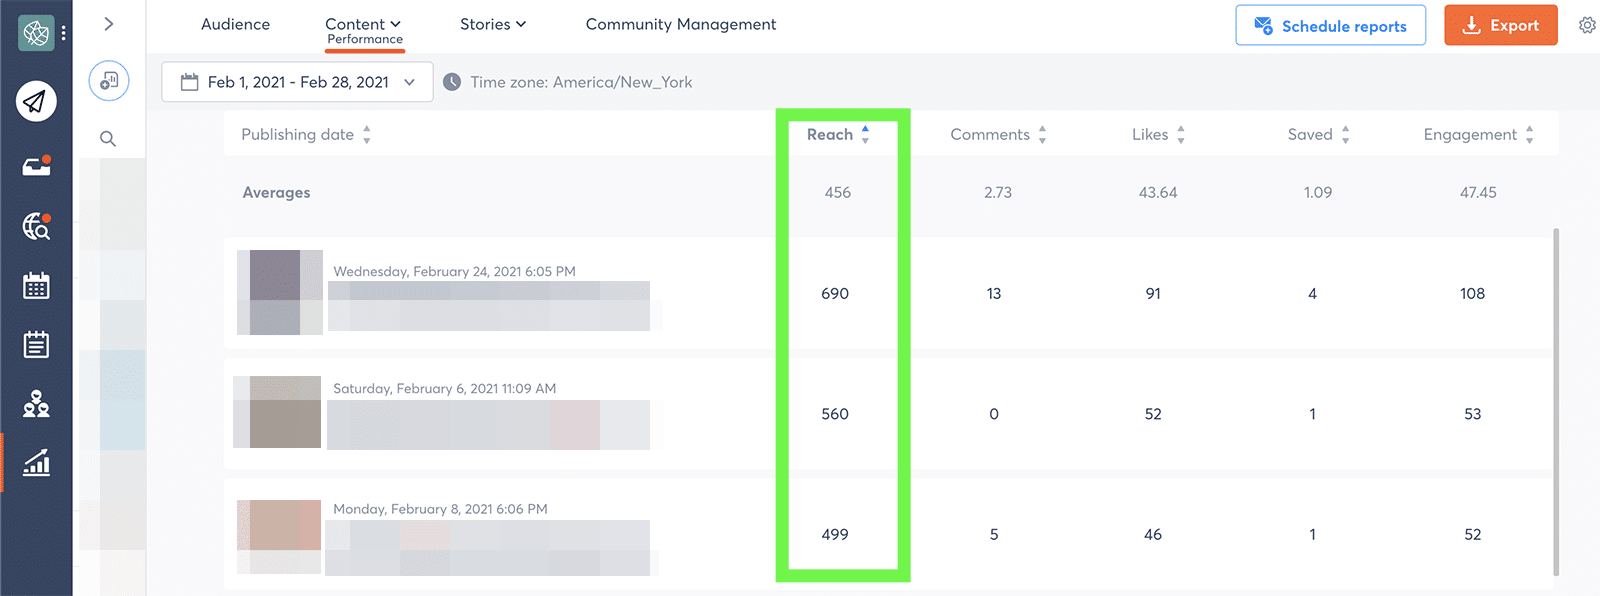
Instagram metrics: reach
To find Instagram reach in your Agorapulse dashboard, go to your content report. At the top of the report, you’ll see the total reach for the time frame. Click on your content performance report to view reach metrics for each post you published during the time period.
Instagram Impressions
Impressions indicate how many total times your posts appeared in Instagram users’ newsfeeds.
Essentially, impressions are the total views your content received during any time frame.
Although reach and impressions are similar, monitor both of these social media metrics. When collecting data on impressions, you make it easier to calculate other helpful metrics like engagement per post.
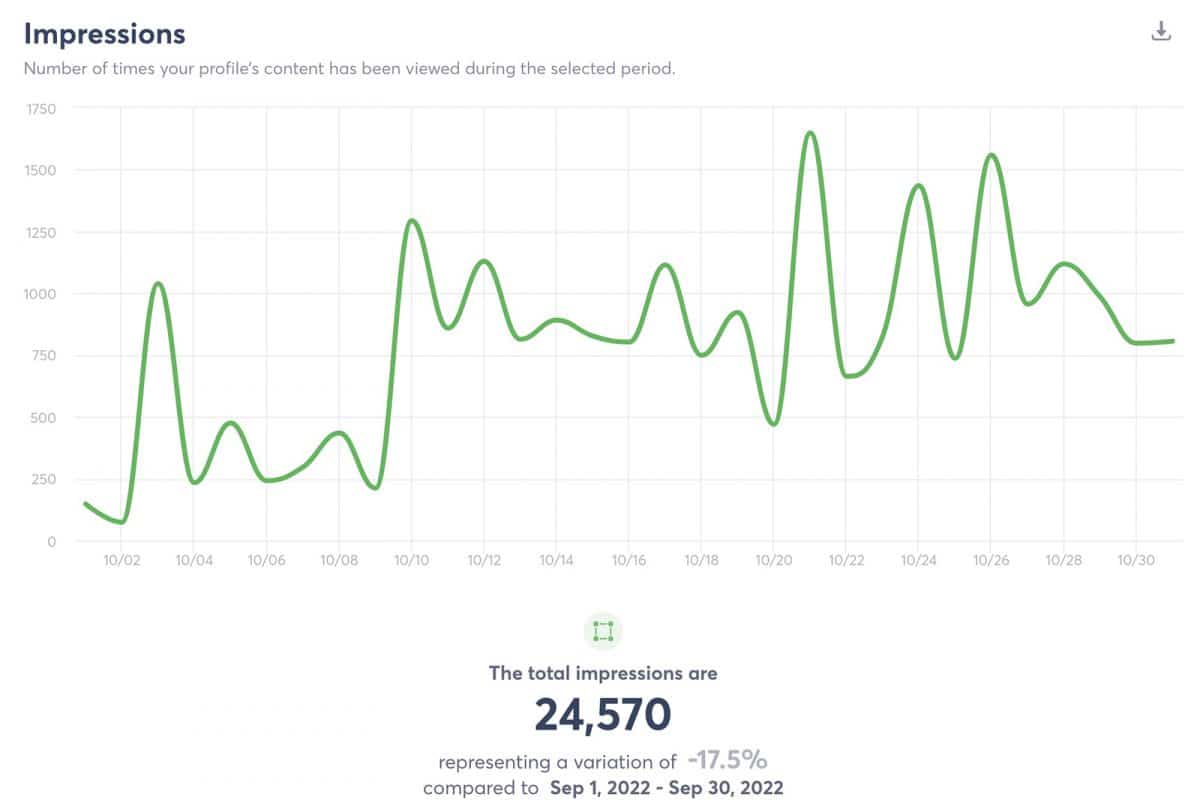
To check your Instagram impressions, go to Agorapulse’s audience reporting dashboard. Scroll down to see the total impressions for the time frame you selected and see how content views fluctuated throughout the time period.
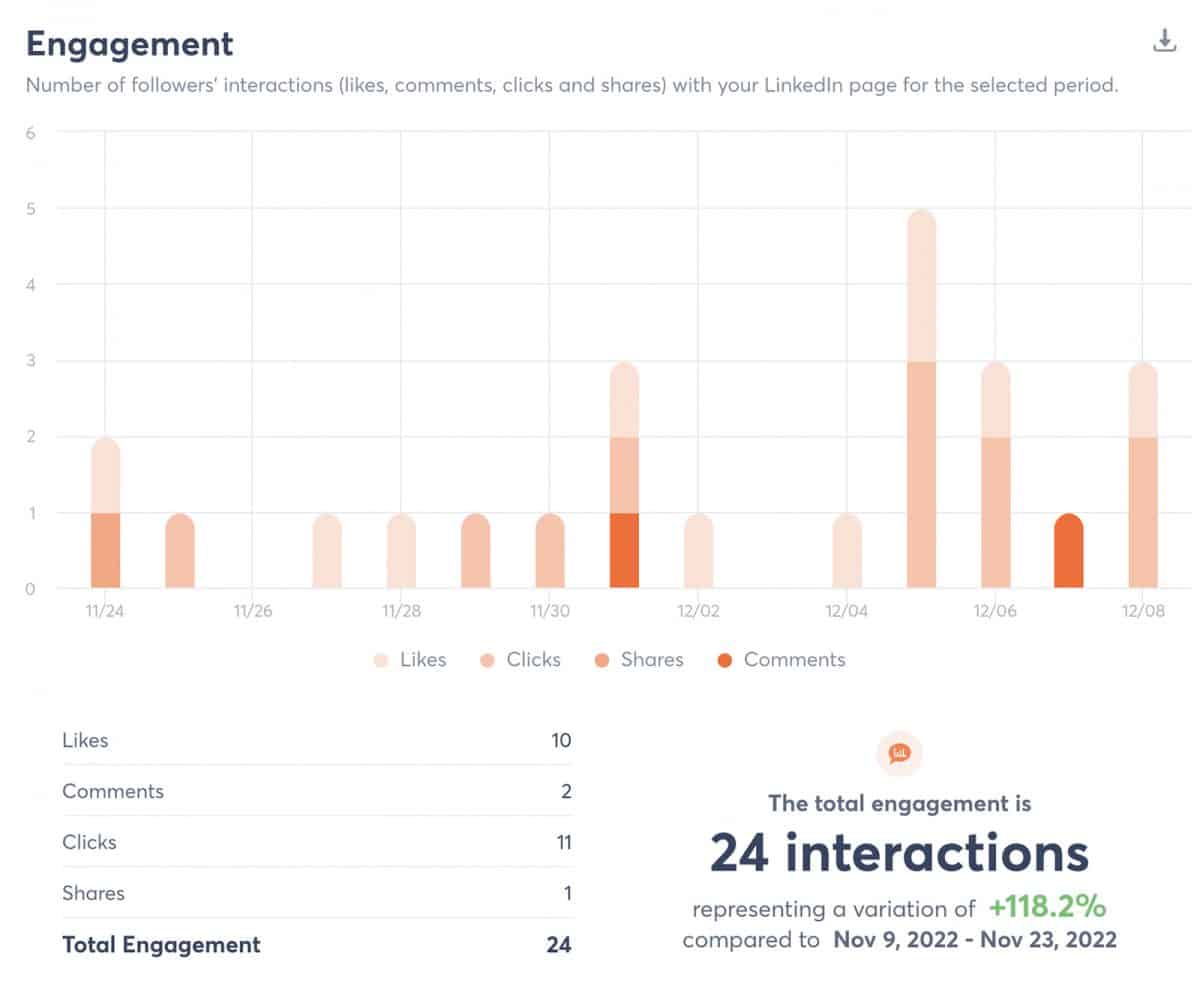
Instagram Comments Received
Impressions and reach are clearly important. But you want your audience to do more than just view your content, right?
Monitor how followers interact with your content.
By tracking the number of comments your content received, you can make sure people are responding to the extent that you’d hoped.
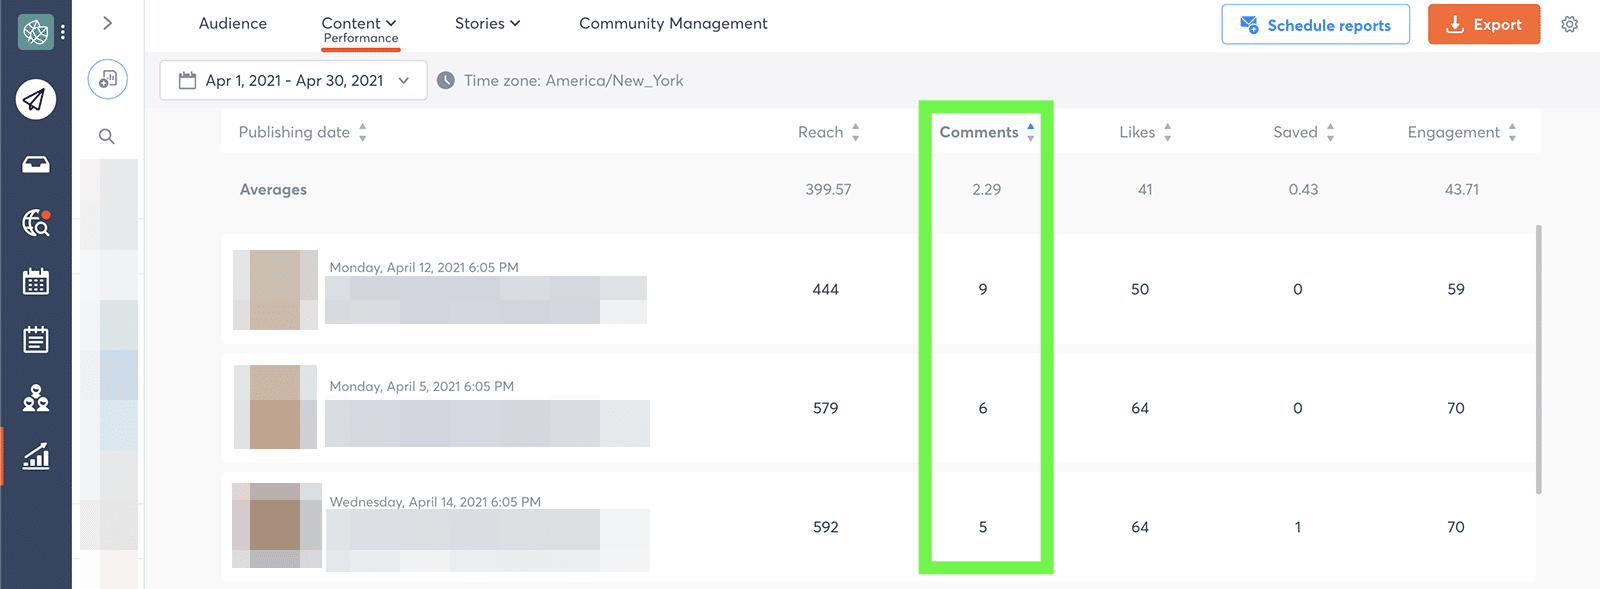
Instagram comments
You can get data on Instagram comments in your Agorapulse content performance report.
Sort by comments, and you can instantly see which posts received the most notes from followers.
Instagram comments
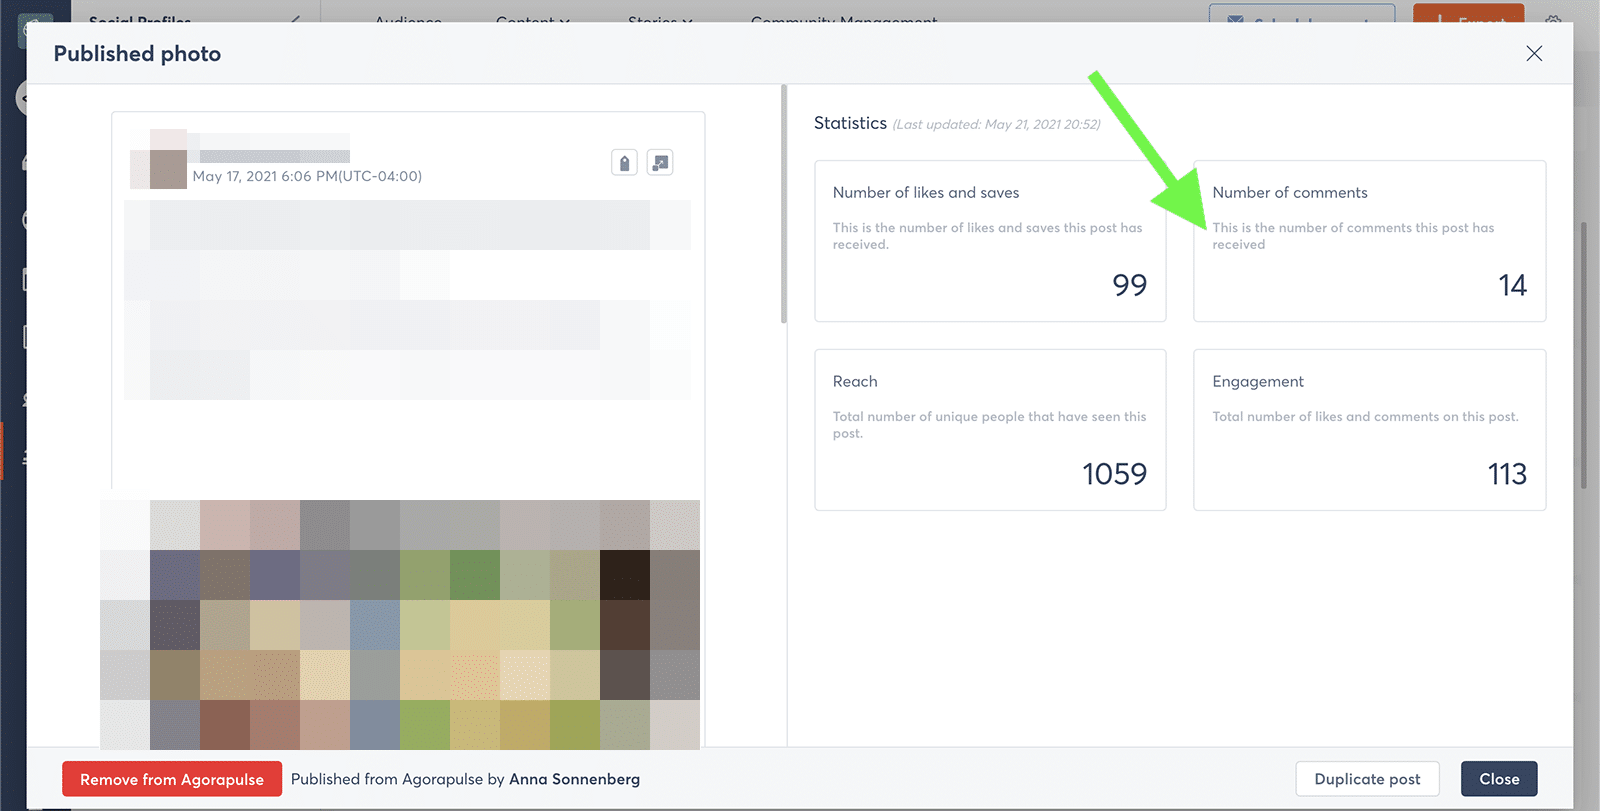
You can also click on individual pieces of content to see the full original post. From this window, you can duplicate the post in Agorapulse if you want to schedule Instagram content in a similar vein.
Post Engagement Rate
Comments are a great way to assess Instagram engagement since they reflect a relatively high level of interest in your posts.
But they’re definitely not the only type of engagement you’ll want to track.
Agorapulse’s content performance report also includes likes and saves. So, you can stay on top of how many people appreciate your posts and file them away for further consideration.
Measuring total engagement per post can be useful for gauging interest. But what if each post reaches a very different number of people? Of course, your total engagement will be all over the place, too.
Instead, take a minute to calculate your Instagram post engagement rate.
Here’s a super simple formula:
(Comments Per Post + Likes Per Post) / Reach Per Post = Post Engagement Rate
Some social media teams divide the total comments and likes by impressions rather than reach. You can factor in impressions instead if they better reflect your team’s goals. Just make sure your formula is consistent so you can track progress over time.
Engagements per Follower
You might assume that all the engagement your Instagram account generates comes from followers. This isn’t necessarily true. Engagement can also come from people tagged in the comments or users who find your content in the Instagram Explore feed.
Keep track of how your followers interact with your content–as opposed to focusing on all Instagram users. You want your followers to be as engaged as possible. A big account with minimal follower engagement won’t help any brand achieve its marketing goals.
Define your social media marketing goals better
To calculate engagements per follower, head to your Agorapulse content performance report to get data on likes and comments per post.
Then divide the total engagement by how many followers your account has.
Check your audience growth report for the exact number of followers your account had on any given day.
Here’s an easy formula to calculate this metric:
(Comments Per Post + Likes Per Post) / Number of Followers = Engagements Per Follower
Instagram Stories Metrics
If your team is leveraging the power of Instagram Stories, you’ll want to track those results, too.
Here are the top metrics to monitor.
Top content metrics
Like Agorapulse’s Instagram post report, the Instagram Stories report automatically highlights your top six posts from the time period. The reporting dashboard sorts content by reach by default.
You can change it to engagement instead if you’re more concerned with how people interacted with your content.
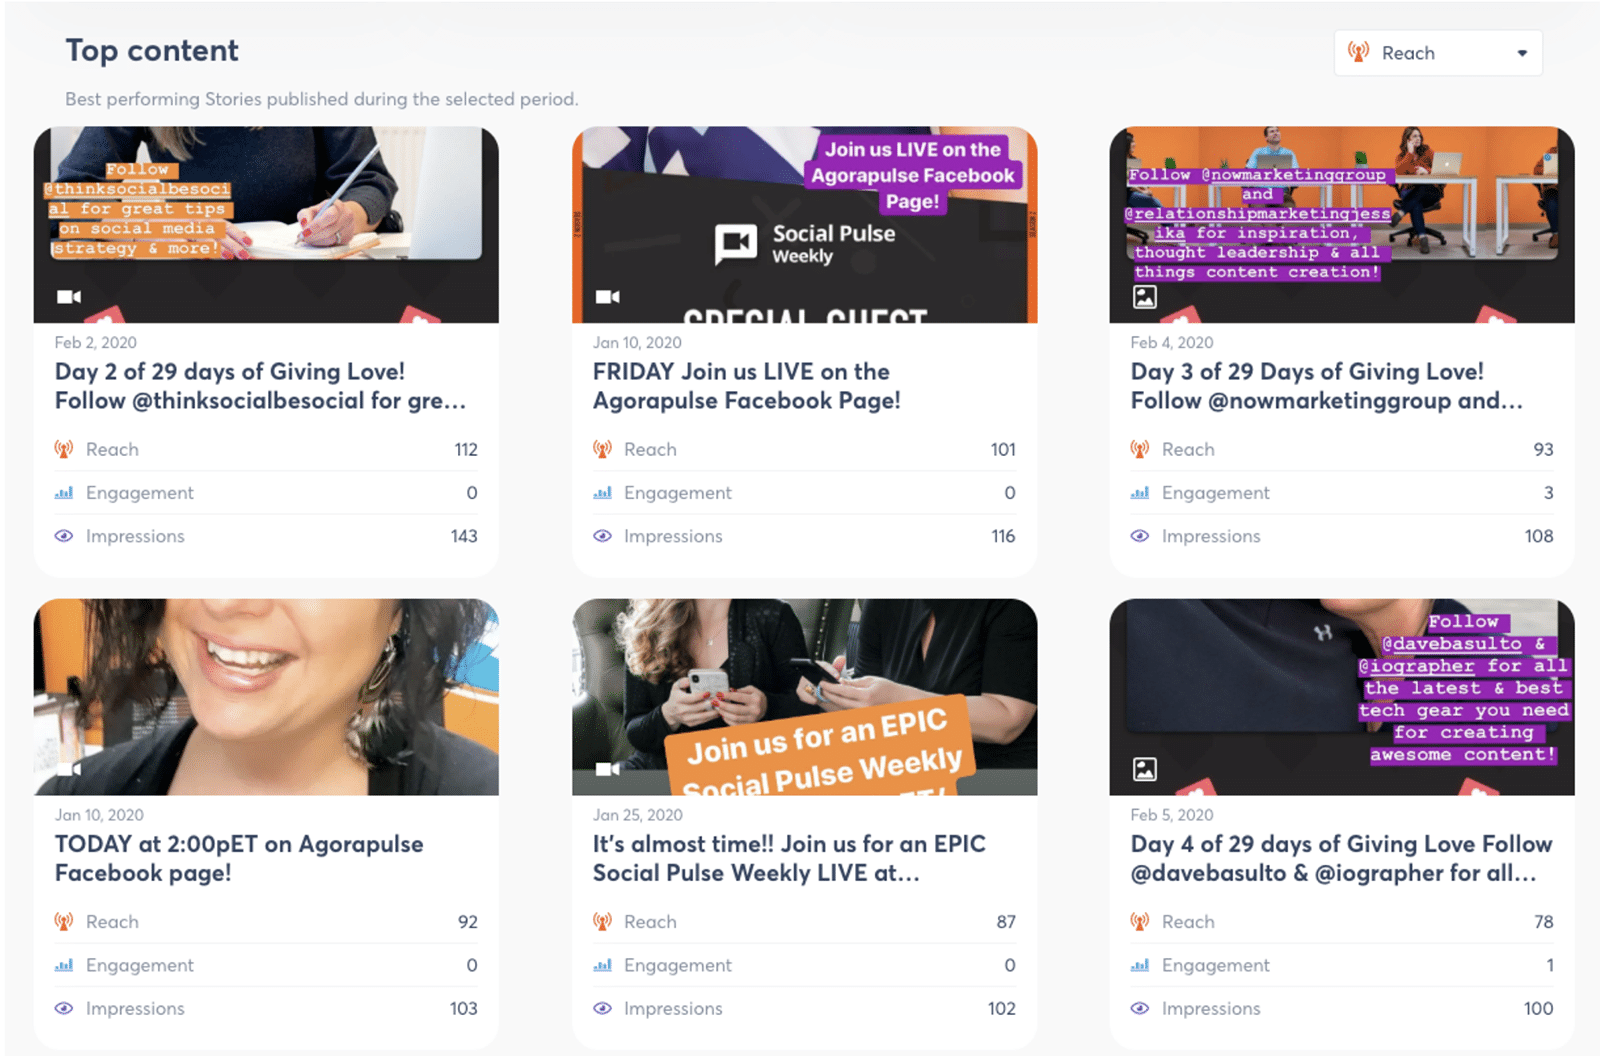
Instagram Stories: Top Content metrics
You can click on any of your top-performing Instagram Stories to access even more metrics.
Agorapulse monitors exits, taps back, and taps forward to help you understand the actions your followers are taking.
Performance metrics
Similar to the Instagram post report, Agorapulse’s content report for Instagram Stories lets you sort by the metrics that matter to your team. At the top of the chart, you can see the average for each metric to benchmark your results.
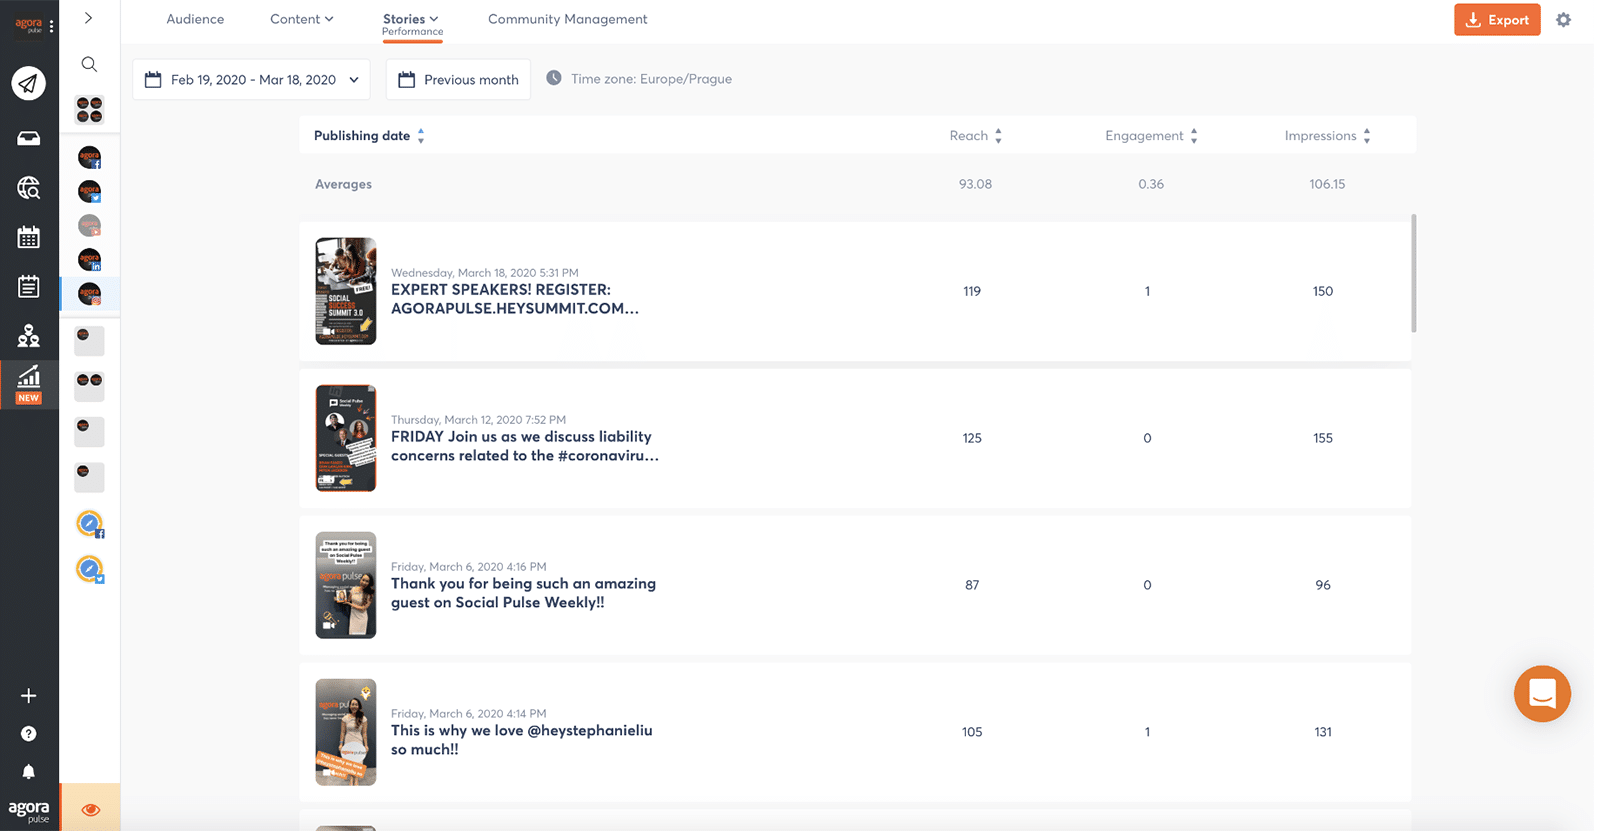
Instagram Stories: Performance Metrics
Then you can toggle the filter to see which Stories generated the greatest reach, the highest impressions, or the most engagement. You can also click on individual Stories for tap and exit metrics.
Hashtag Performance
Hashtags are key to getting more exposure for your Instagram posts.
But are you using the right hashtags for your content? And are they driving the clicks your team wants to see?
Agorapulse automatically tracks the hashtags you use on Instagram and compiles the results for your review.
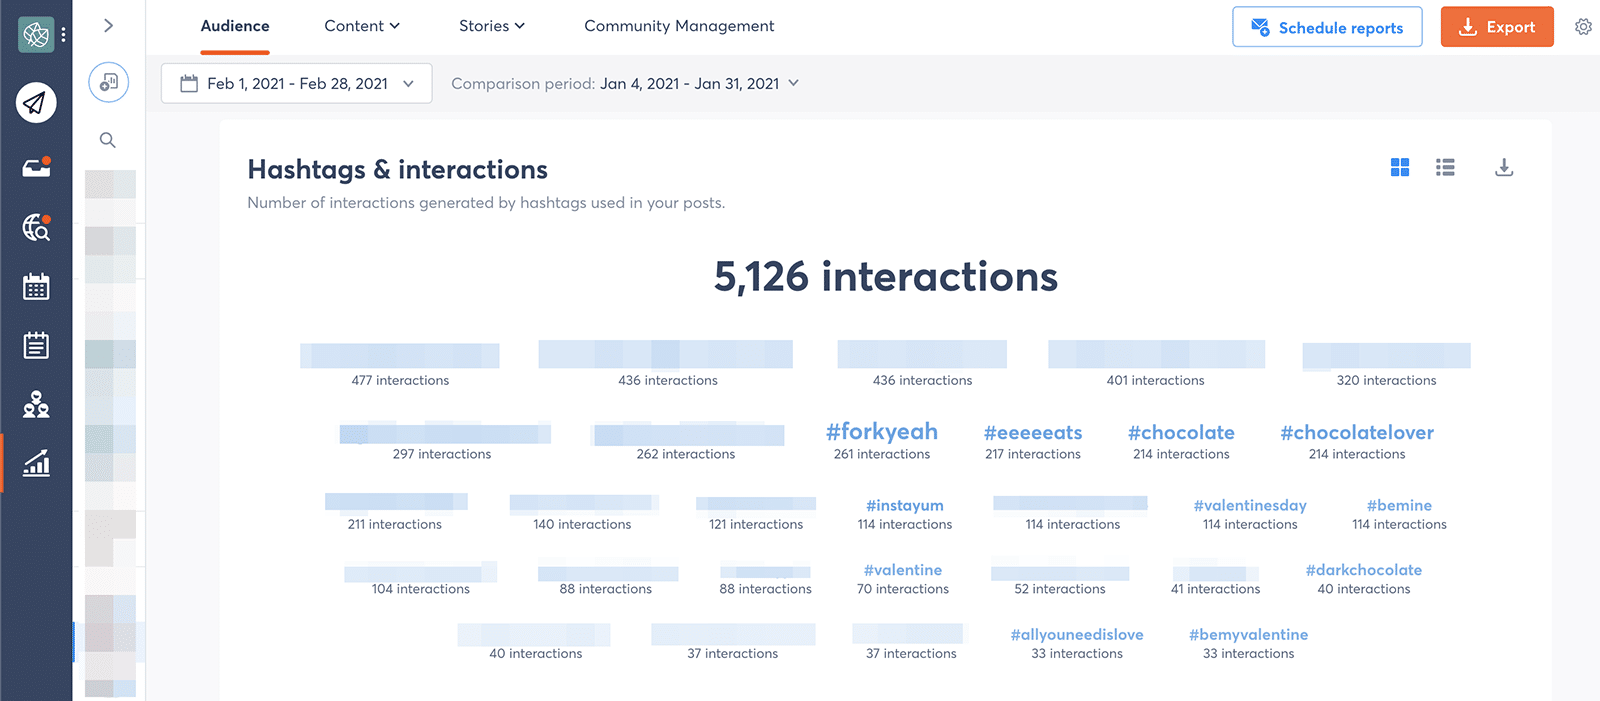
Hashtag metrics
Agorapulse’s hashtag report generates a sort of word cloud, showing your most popular hashtags in the biggest typeface. With a quick glance, you can get a sense of your top performers, or hashtags that drive the most interactions.
Most Engaged Hashtags
But the default hashtag report doesn’t tell the whole story. The hashtag cloud only includes your top 30 keywords.
Toggle the report layout to see the full list of all the hashtags you used during the time frame.
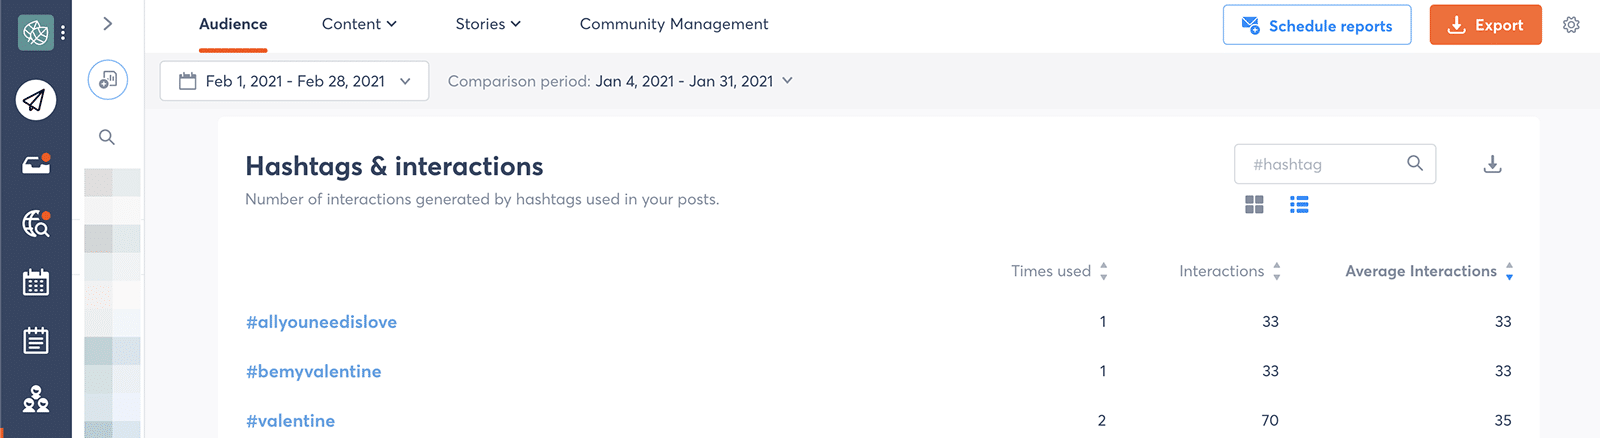
Hashtag interactions
Here’s what you can learn:
- Which hashtags are the best (and worst) performers on average. If you’ve used some hashtags more than once, sort by average interactions to even out the results and find top performers. Click the sorting button again to see the worst performers.
- What type of content you should make more of. Which hashtags performed best? Which posts featured them? Use these top results to plan more appealing content going forward.
- What type of content you should make less of. Did any of your hashtags totally flop? Can you pinpoint why? Think about how you can improve on it in the future or whether you should phase out this type of post.
To process this data more effectively, you can download your Agorapulse hashtag report separately from other analytics. It downloads as a CSV, so you can quickly sort the keywords and add the ones you want to reuse to your content planning workflow.
Instagram Listening Metrics
Hashtags are powerful tools, and you can do more than just track the ones you add to your content.
With Agorapulse, you can set up social listening searches to track hashtag usage across Instagram.
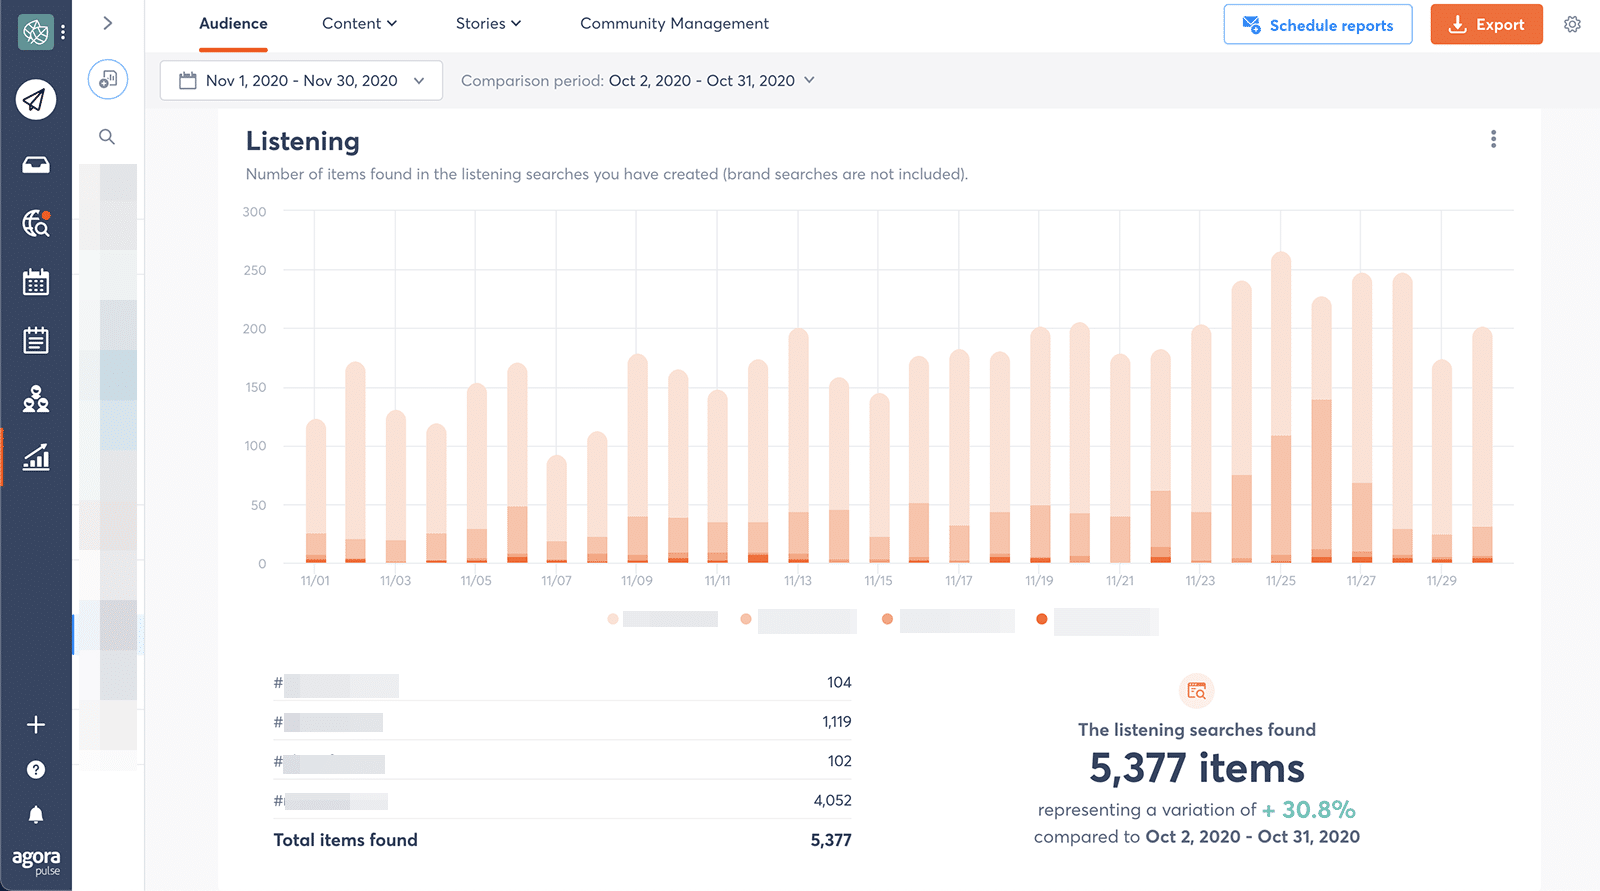
Chart: Social Listening
Your Agorapulse listening report reflects the total usage for all the hashtags you track, broken down by day. This is a great way to gauge hashtag popularity and identify trending terms.
This chart can also help you identify outliers. For example, you can spot days when certain hashtag usage skyrocketed, which can alert you to breaking industry news or viral content.
Tips for Agencies
Monitoring Instagram metrics for multiple agency clients can get tricky if you don’t have systems in place. Use these tips to streamline reporting and add more impact to your work.
Track customer sentiment
Do your clients want to know how Instagram followers feel about their brand?
With Agorapulse, you can create a series of labels–such as positive, neutral, and negative–and then apply them as appropriate to comments and DMs. Then you can check Agorapulse’s label report to gauge customer sentiment and make sure you’re hitting the right note.
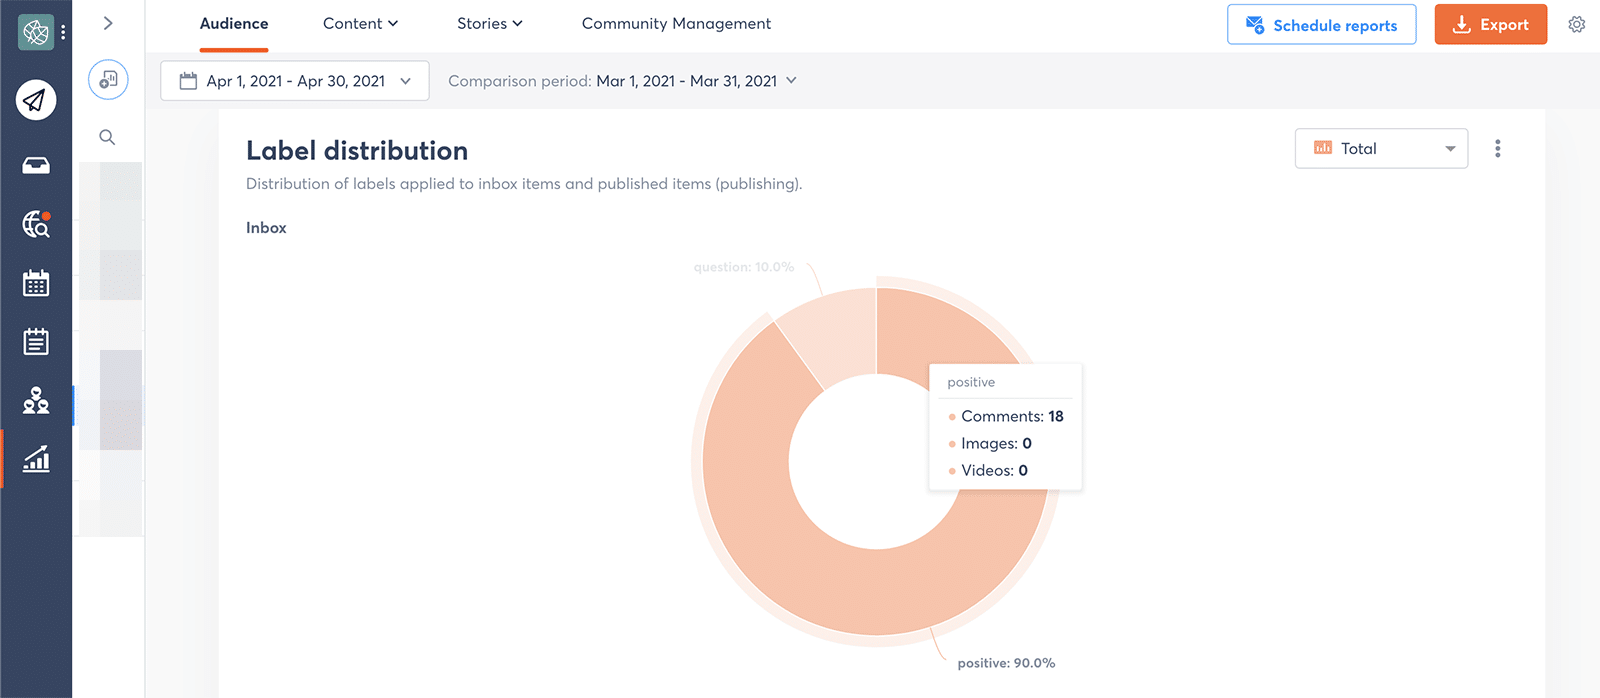
Chart: Agorapulse customer sentiment metrics
If your clients’ Instagram accounts receive a lot of engagement, it might make more sense to automate this process.
Look through past engagement and make a list of the words they use–such as “best” or “frustrated.” Then create automated rules for the content that arrives in your Agorapulse Social Inbox. The next time you need to create a sentiment report, most of the work will already be done for you.
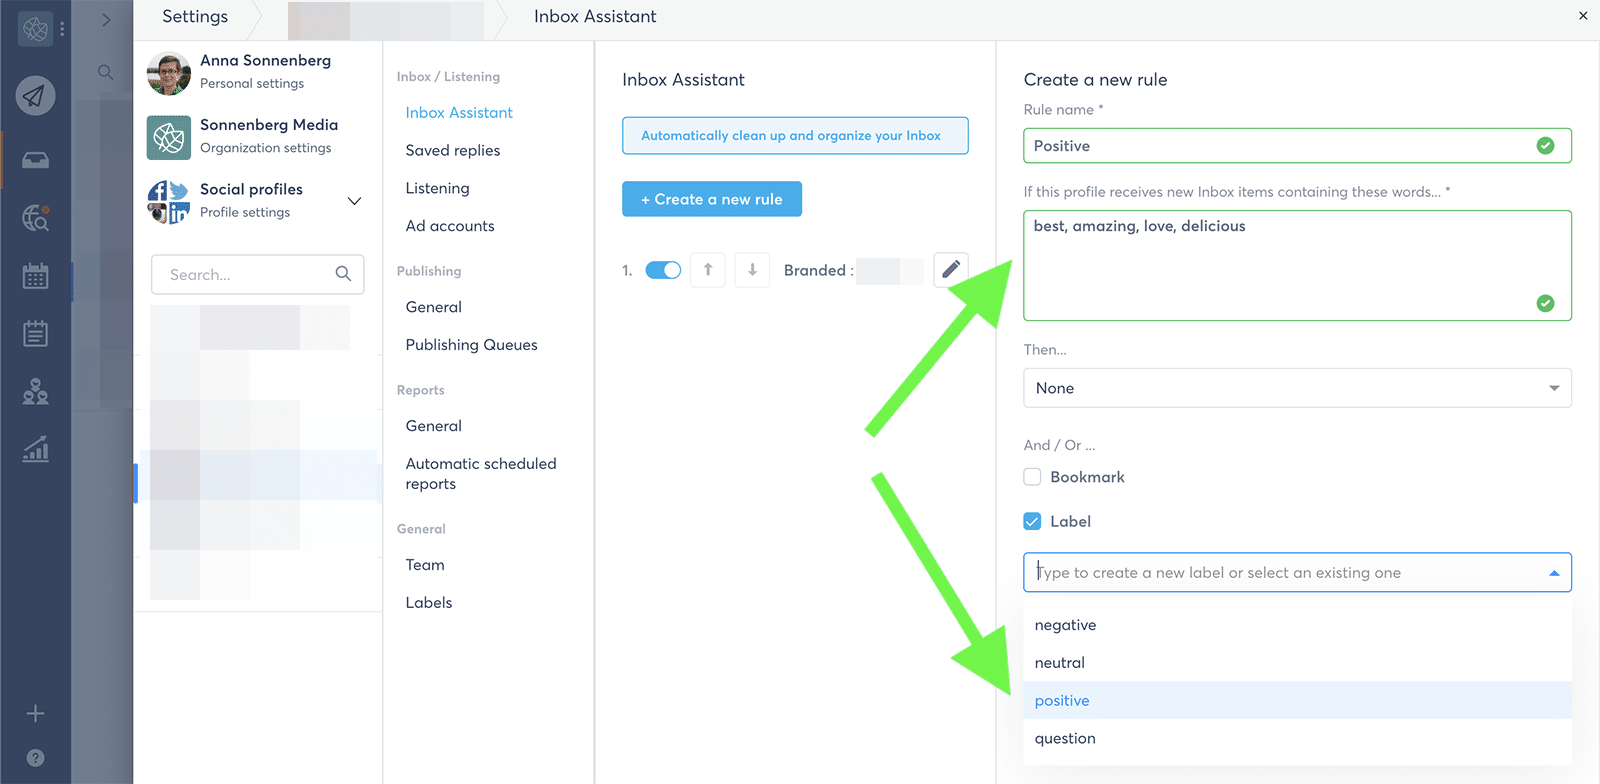
Agorapulse Inbox Assistant
Alternatively, if you have purchased the advanced listening add-on, you are able to view your sentiment score of a created listening search. The sentiment will be automatically detected and applied to the items that you listened to. However, some items may not be analyzed because they are not in English or French.
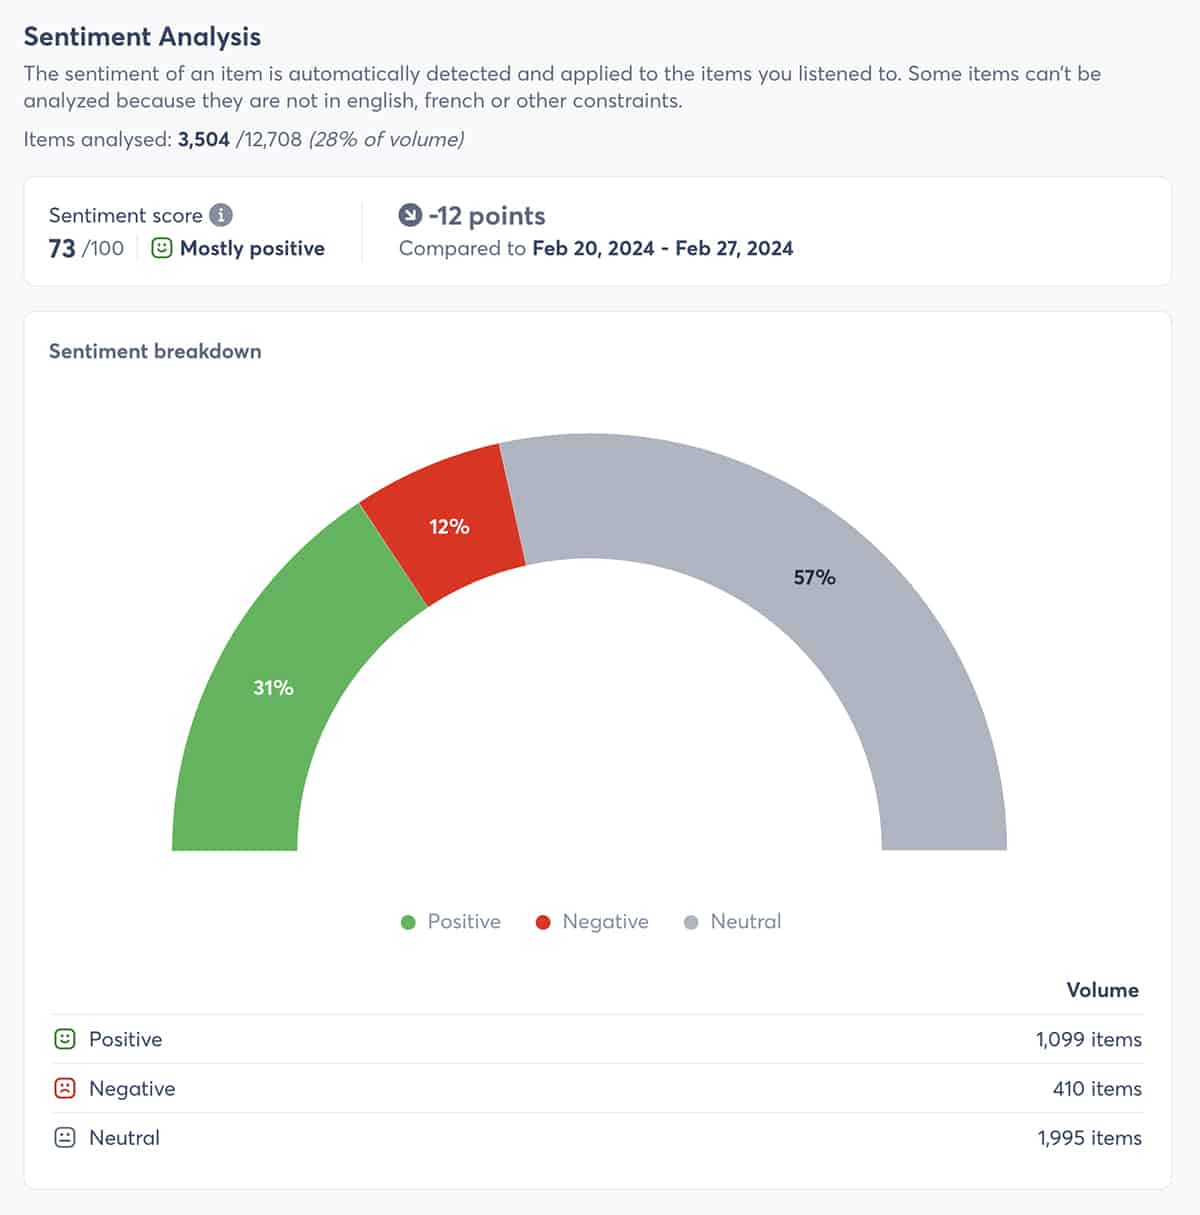
The sentiment of an item is automatically detected and applied to the items you listened to.
-
Sentiment score is calculated as the ratio of positive items divided by the total of positive and negative items. A score under 50 means you have more negative than positive items. A score over 50 means you have more positive and negative items.
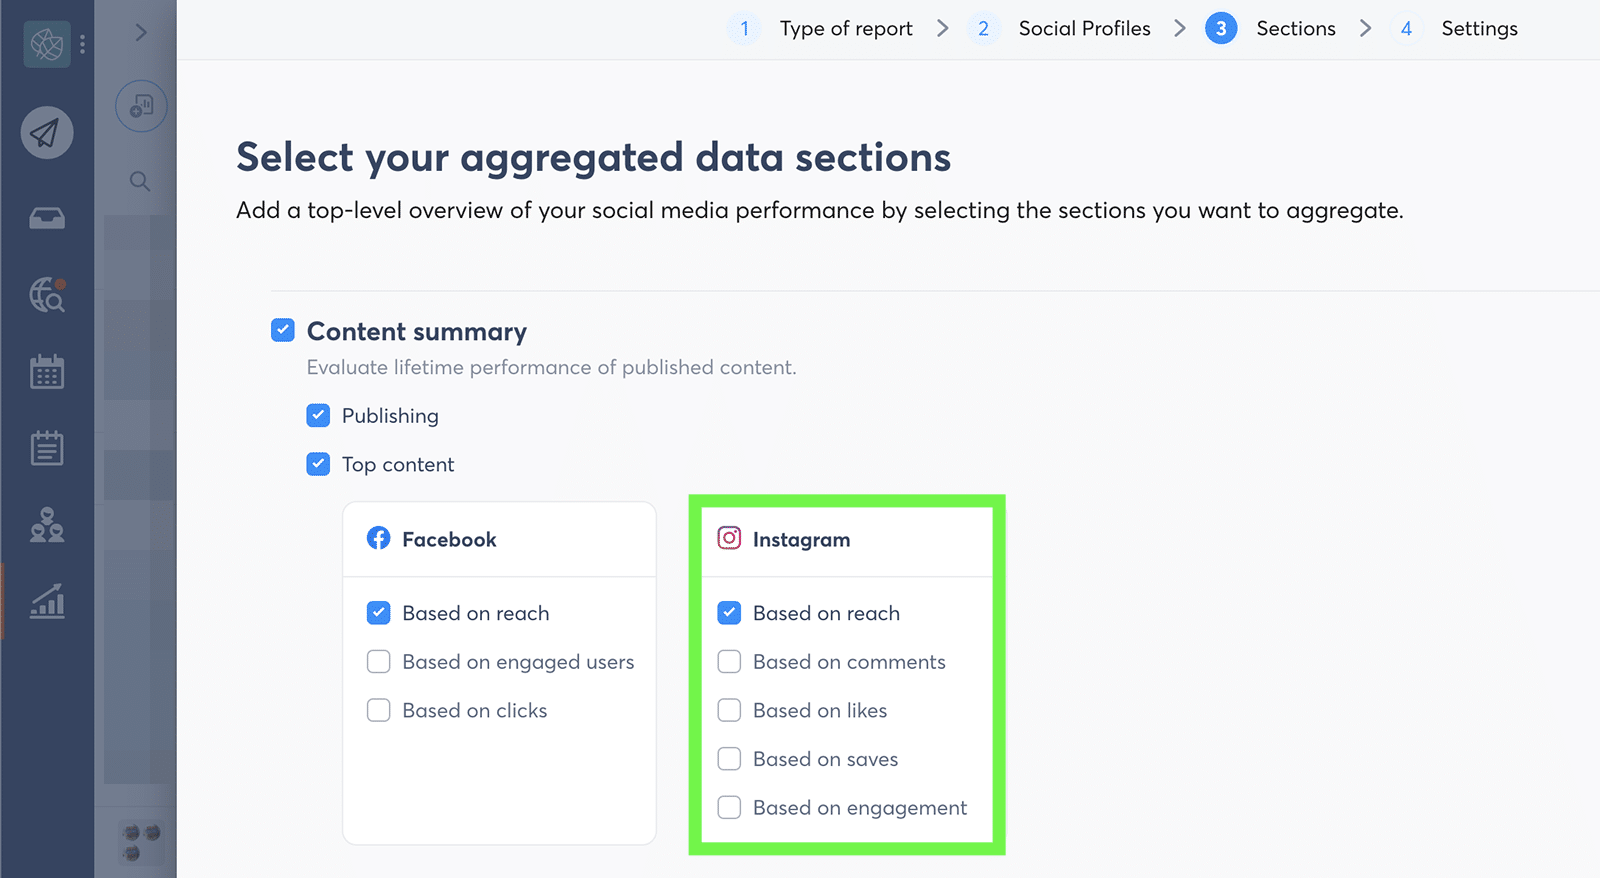
Build custom reports
Reporting doesn’t have to take up half of your week. With Agorapulse, you can create custom reporting templates that you can reuse every week, month, or quarter. Better yet, you can create a different custom analysis for every client so you can knock their socks off every time.
agorapulse customized reports
To create your custom report, start by adding the Instagram profile you want to feature. If you want a comprehensive report for a client, you can add other social channels as well. Then choose the metrics you want to include and the criteria for determining top content. You can revisit or share this custom report without having to recreate it constantly.
Schedule client reports
To save even more time, simply schedule your custom reports to send like clockwork.
You can automatically send Agorapulse reports to anyone on your team (including external members) every week or month.
Rather than sending your reports directly to clients, however, consider sending them to yourself or to a team member first. That way you can review the results, add your analysis, and then forward the complete report to your clients.
In Conclusion
Whether you’re just getting started with social media analytics or you really need to overhaul your reports, these Instagram metrics are a great place to start. Once you have a sense of typical results from your account and the goals you want to achieve, you can zero in on the Instagram metrics that matter most for your brand and your team.
Check out our free trial of Agorapulse if you want to save time with your Instagram reporting and management.


![Feature image of What’s the Best Time to Post on Instagram? [2026]](https://static1.agorapulse.com/blog/wp-content/uploads/sites/2/2023/02/Best-Time-to-Post-on-Instagram-Blogpost-Header-1200x508.jpg "Feature image of What’s the Best Time to Post on Instagram? [2026]")
