

To create high-performing social media content, you need to know what resonates with your target audience. But how do you know what your followers want to see?
Engagement analytics reveals what makes your audience click, consume, and convert. With engagement data, you can better understand your audience and create more compelling social media posts.
Discover how to find and evaluate engagement analytics and learn how to use these insights to publish more successful content for your company or agency clients.
What Are Engagement Analytics?
Engagement analytics refers to processing and evaluating marketing content metrics. It reveals how people engage with your digital content. It also helps you uncover patterns and trends.
In other words, engagement analytics helps you make sense of the results your content generates. Because analytics is based on data, it also allows you to make informed decisions about your content and your marketing strategy.
That means you can use engagement analytics to improve your social media marketing strategy and work toward better outcomes. As a result, your social media marketing efforts can provide more value for your company or agency clients.
Engagement metrics to measure
Engagement analytics can include a long list of social media metrics. Which should your team monitor? It depends on your business goals and the social media metrics that matter most to your team. It also depends on the channels you use and the platforms where you measure conversions.
For example, say you want to understand how your audience is reacting to your brand’s social media content. The most common social media engagement metrics include:
- Likes and reactions
- Comments and replies
- Private or direct messages (DMs)
- Shares and retweets
- Saves
You may also want to evaluate how your audience is reacting to your brand’s website content. What is an engagement rate in Google Analytics? You can find it by measuring website engagement metrics like:
- Users
- Page views
- Time on page
- Sessions per user
- Events
- Conversions
- Downloads
Key types of engagement analytics
In addition to evaluating different engagement metrics, you can divide your audience into various segments. By tracking segments separately, you can better understand the actions that different types of users take.
Your team may find it helpful to measure these common types of analytics:
- Customer engagement analytics, which include people who have purchased from your company or who fit your ideal buyer persona
- Employee engagement analytics, which include people who work for or support your business or your agency clients
Seven Reasons Why Engagement Analytics Matter
Engagement analytics can tell you a lot about what your audience prefers and what prompts them to act. Let’s look at some of the most important takeaways you can get from engagement analytics.
1. Get more audience reactions
It’s true that social media likes and reactions don’t equal sales or revenue. But likes and reactions do tell social media algorithms that people are enjoying your content.
That can result in social platforms displaying your content more frequently. And more social media impressions means more touch points—which can lead to sales.
By tracking likes and reactions, you can understand what your audience wants to see more of on social media. Then you can create more relevant content that appeals to your audience.
For example, you may find that short-form video drives exponentially more likes and reactions than image or text posts do. With those insights in mind, you may decide to produce more short-form videos.
Over time, you’ll collect more short-form video engagement analytics. Then you can use your insights to determine the topics and approaches your audience likes best—and continue to fine-tune your content strategy.
2. Increase comments and messages
Likes and reactions typically signal a positive response to your marketing content. Yet many marketers consider likes and reactions to be lower-level engagement metrics that convey only a basic level of interest.
Because comments and messages require more time and thought, marketers often consider them higher-level engagement. Since comments and messages include much more detail, they can also express more complex sentiments.
By tracking comments and messages on your social media content, you can understand the types of posts that generate the most valuable engagement. Then you can adjust your content strategy to get more of that type of engagement.
For example, you may find that posing questions in social media captions works best for getting comments. Or you may find that asking followers to comment with a keyword allows you to respond with a DM—which can reinforce relationships with followers.
3. Evaluate customer sentiment
When you take the time to review the comments and messages your social profiles receive, you can better understand how people view your brand. Using this newfound knowledge, you can create more effective content and promotions.
For example, you may have noticed a dramatic uptick in DMs. On the surface, that may seem like a good thing. But what if 90% of the DMs are complaints or requests for support rather than positive messages?
With engagement analytics, you can understand the sentiment behind the comments and messages you receive. That way, you can respond to engagement more effectively and get other teams involved when necessary—before crises happen.
4. Understand the customer journey
You may think you know the path that prospects take before they become paying customers. But over time, the customer journey can evolve based on the channels you use, the content you publish, and the offers you create.
By tracking social media and website engagement analytics, you can be sure about the path your customers take. You can also understand how they move from one stage to another and identify what prompts them to take the next step.
The more you know about your customer journey, the more you can experiment with it. In other words, you may discover ways to consolidate multiple steps and shorten the path to a conversion or sale.
5. Improve sales and conversions
When conversions and sales are your main marketing goals, you need to know what gets customers to sign up, book an appointment, or make a purchase.
Engagement analytics can tell you what prompts people to click and convert. With that knowledge, you can create better offers and publish content that drives more sales.
Do you want to know which of your current offers drives the most revenue? You can track clicks, page views, or conversions to find out which social media post or website link generates the best results. Then you can focus on promoting the most successful offer.
6. Identify top-performing channels and campaigns
It’s easy to make assumptions about top-performing marketing channels and campaigns. For example, say you launch a new Facebook ad campaign. Within a week, sales have more than doubled, and growth shows no signs of stopping.
It’s all because of the Facebook ad campaign, right? Engagement analytics can help you determine which channels are driving traffic to your site and which are responsible for sales and conversions.
If you set up UTM parameters, then you can also identify which social media campaign is responsible for the increase in revenue. Using these insights, you can attribute results accurately and plan more successful campaigns in the future.
7. Allocate marketing resources
When you know the channels, campaigns, and tactics that generate the results you want to achieve, you can allocate resources much more effectively. That means you can focus on the marketing efforts that produce the highest return on investment (ROI).
For example, your social media and website analytics may indicate that Facebook ads have a much higher conversion rate and ROI than other types of campaigns. With that knowledge, you can continue to run campaigns that get the results you want.
How to Find and Use Website Engagement Analytics
When you use Google Analytics, you can easily track and review engagement on your website. Here’s how:
1. Install or switch to Google Analytics 4
Universal Analytics can show you basic engagement metrics like page views and bounce rate. But when you want to find engagement rate, Google Analytics 4 (GA4) is critical. Use these instructions to install or switch to GA4.
2. Set up conversion events
By default, GA4 measures several standard engagement events. For example, it tracks the first time someone visits your site as well as every page view. But it doesn’t monitor the conversions that are specific to your business.
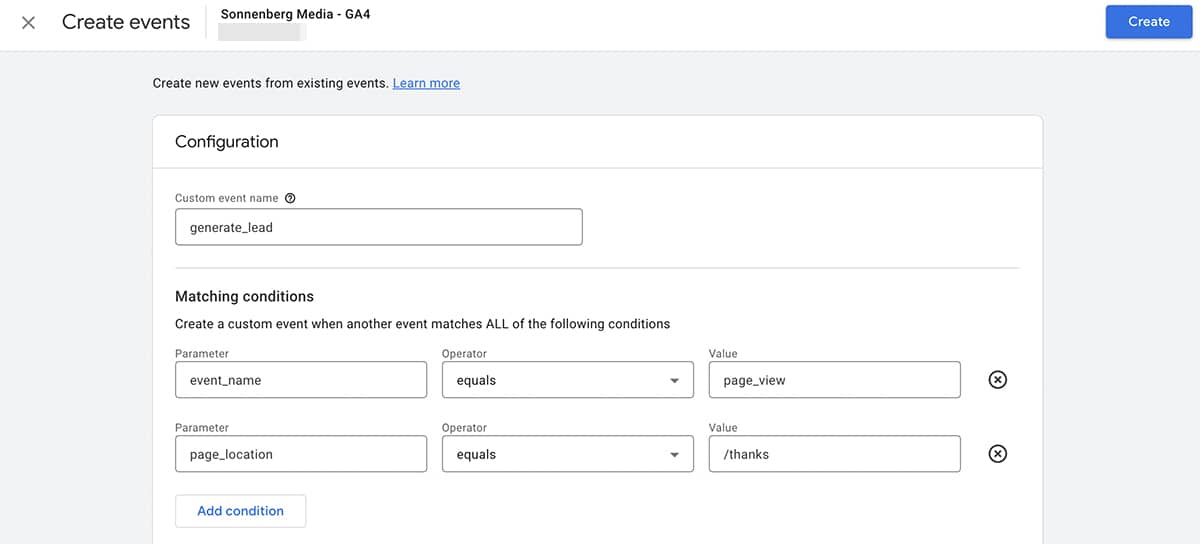
To set up a conversion event, open your GA4 account and click the Configure panel in the left menu. On the Events tab, click the Create Event button. Then give the event a name and set the conditions.
For example, say you want to track lead generation. Choose a standard event like “generate_lead” and then input “page_view” as the first matching condition. For the second matching condition, choose “page_location” and input the slug for your lead generation confirmation page. Click the Create button.
Then open the Configure menu and choose Conversions. Click the New Conversion Event button and enter the name of the event you just created. Then go back and repeat the process as necessary to create all the conversion events you want to track.
3. Check GA4 engagement reports
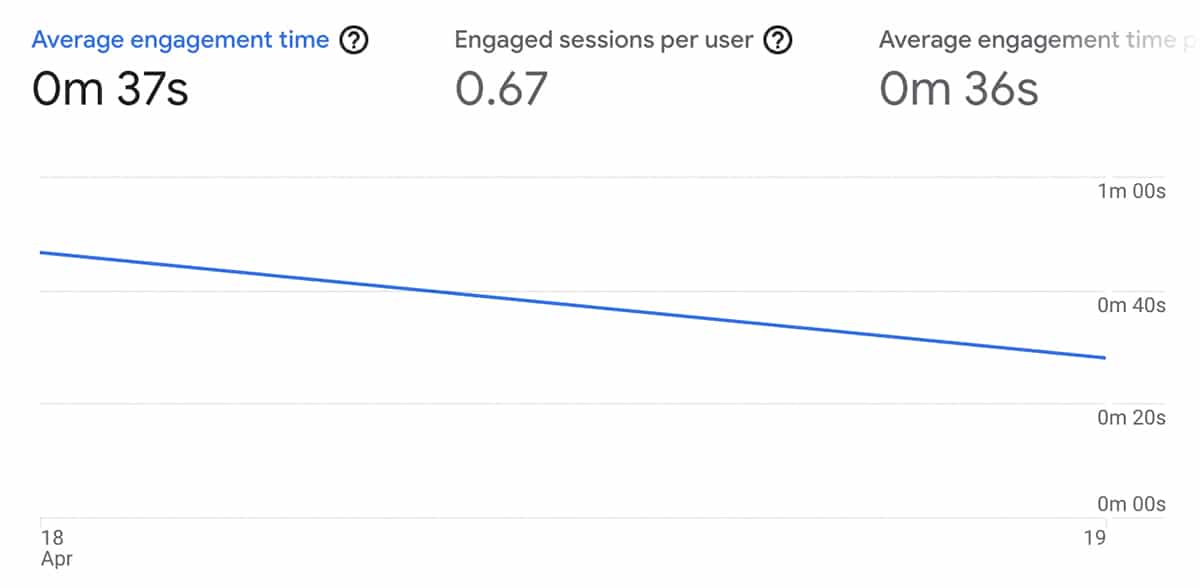
To see how website visitors interact with your comments, open the reports tab in your GA4 dashboard. Open the Engagement dropdown menu and select Engagement Overview. On the main chart, you can toggle between the following metrics:
- Average engagement time, which reflects how long people interacted with your content
- Engaged sessions per user, which shows how many times people visited your site
- Average engagement time per session, which indicates how long people interacted with your site during each visit
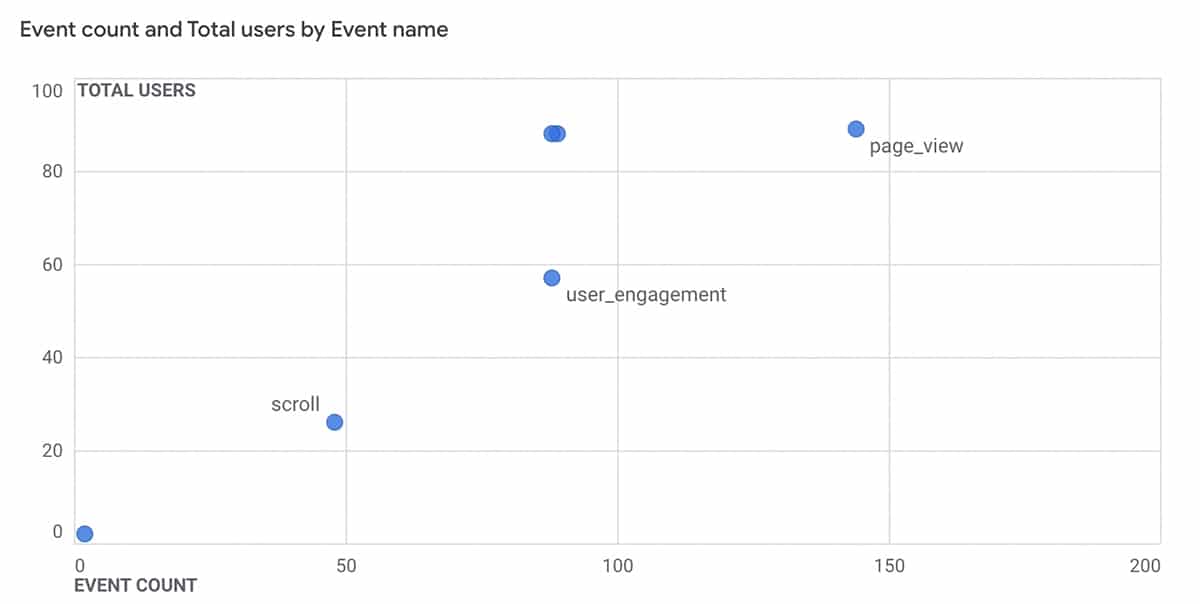
GA4 also shows how many views your website has tallied during a given time period as well as the total number of events. You can scroll down to see a list of event names and counts for your site.
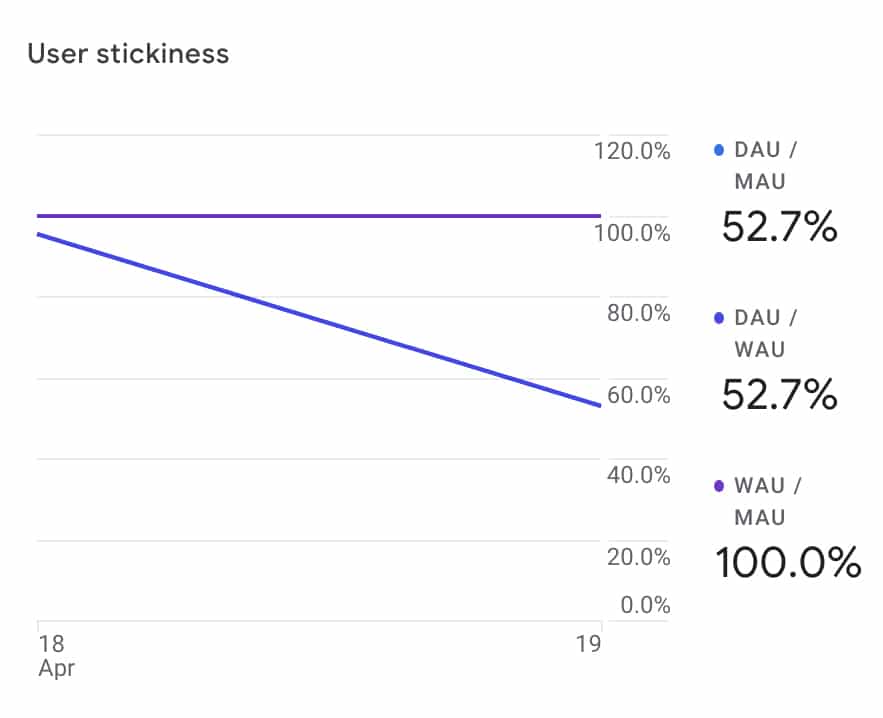
Are you curious whether your website engagement rates are on the rise or on the decline? The User Stickiness chart provides an in-depth overview of engagement by active users. You can see how daily, weekly, and monthly active users compare to spot engagement and user retention trends.
4. Review page, event, and conversion reports
For a deeper dive into user analytics, check the Events and Conversions reports. The Events report charts website events including user engagement. That means you can easily track website user engagement and ensure that it’s holding steady or increasing over time.
On the Conversions tab, you can see a similar breakdown. Instead of viewing all event analytics, however, you can see just the conversion events you created.
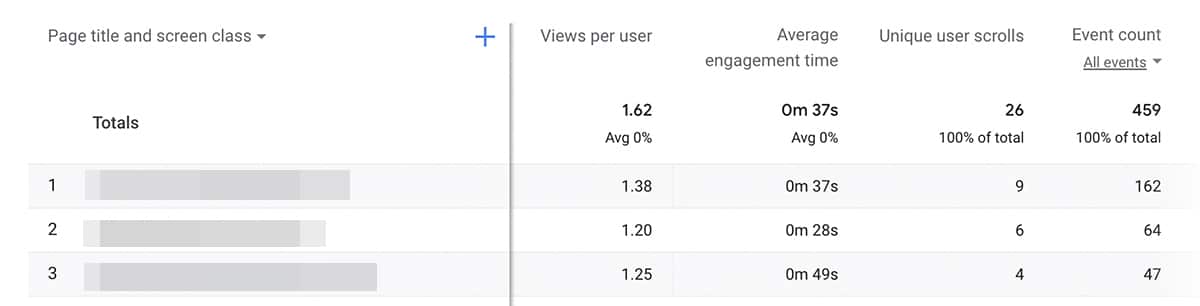
Do you want to know which pages have driven the most views, engagement, or conversions? Open the Pages and Screens tab for a complete breakdown of the events, conversions, and revenue that every page on your website has generated.
5. Analyze retention reports
If your customer journey involves multiple website visits, it’s also important to check the Retention tab in your GA4 account. Here, you can compare new to returning users and view user engagement beyond the first visit.
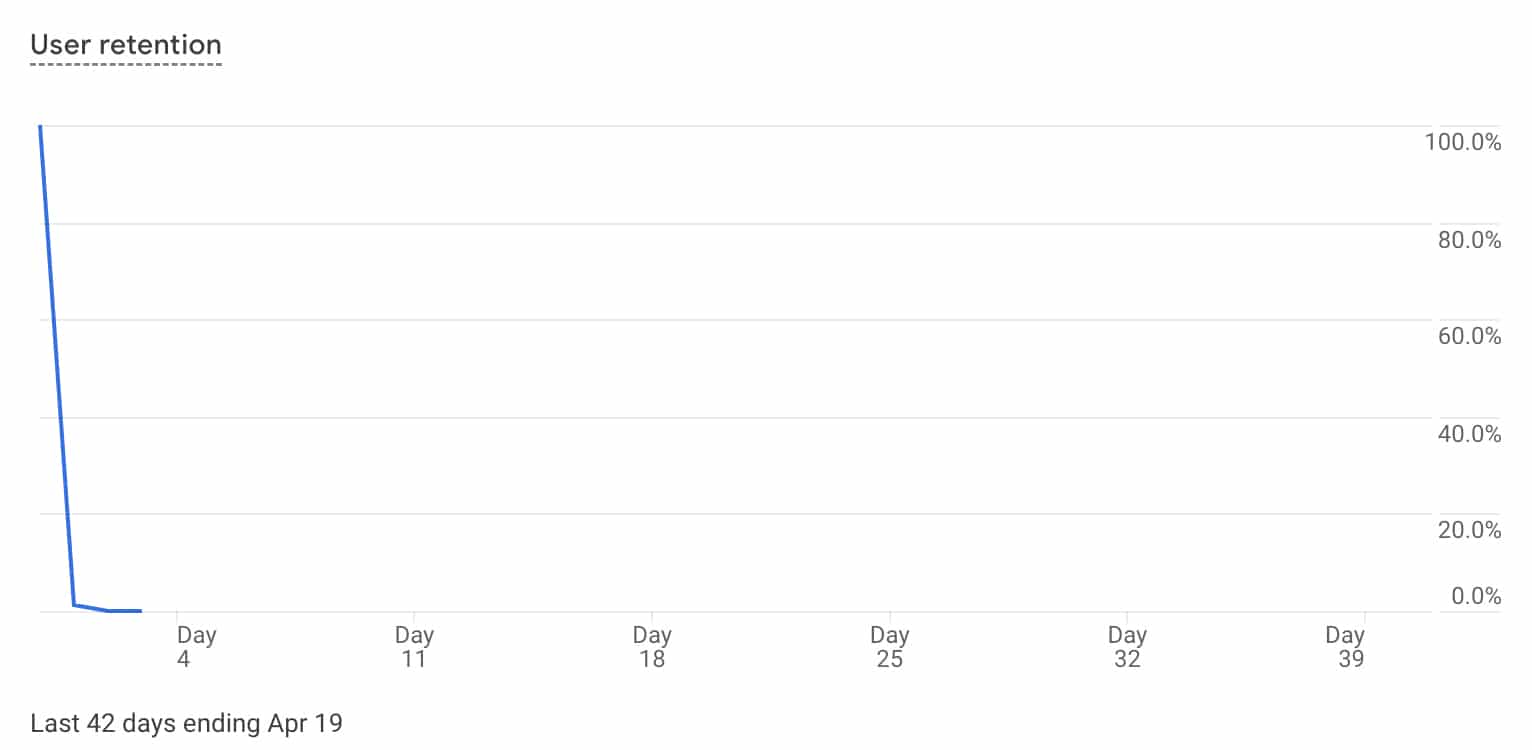
By reviewing this report, you can get a sense of whether visitors are spending more time during subsequent visits. You can also chart the lifetime value of your website visitors, which can help you ensure that you’re continuing to convert and upsell to customers over time.
How to Find and Use Social Media Engagement Analytics
With Agorapulse, you can easily track and review engagement across social channels. Here’s how:
1. Connect social profiles and analytics accounts
First, link all your company’s or agency client’s social profiles to Agorapulse. You can also connect Facebook ad accounts and pull data from your paid campaigns.
Then go to the ROI tab and connect your Google Analytics account to the Agorapulse dashboard. That way you can measure website conversions and revenue alongside social media campaign metrics.
2. Review the social media engagement report
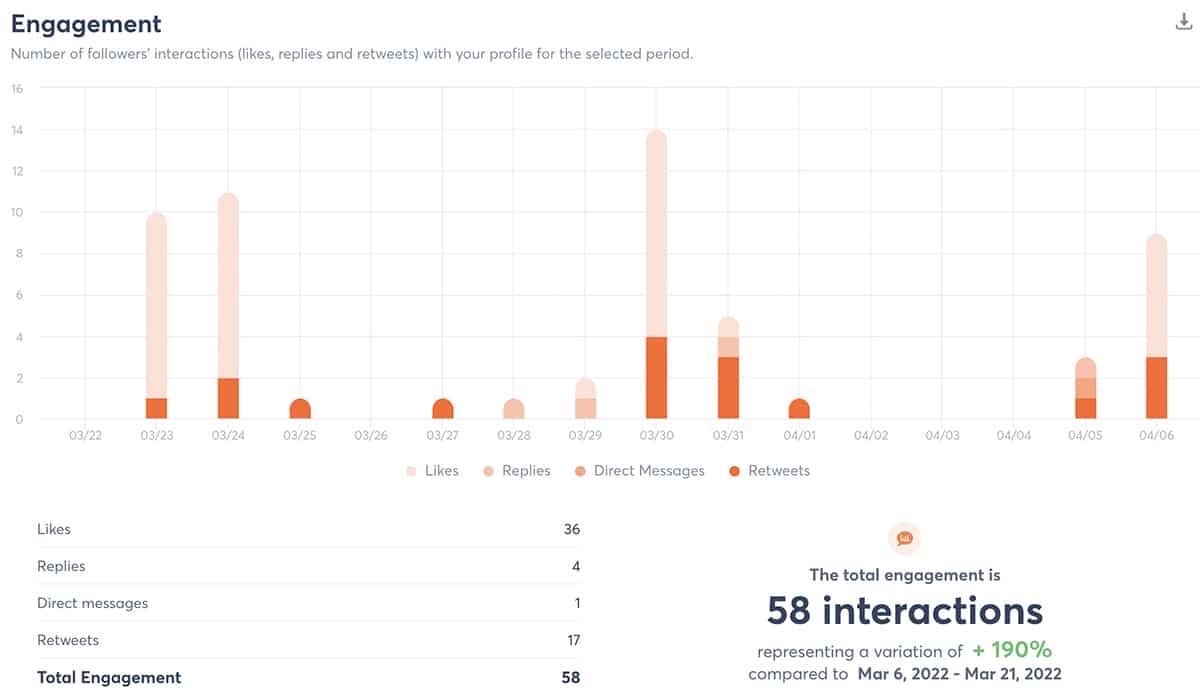
Next, go to the Reports tab and select the social media profile you want to analyze. At the top of the report you can see the total user engagement and how it compares to the previous period. Click the See Section link to view a daily breakdown.
You can see the total likes, comments, shares, and DMs for each day of the time period you selected. Hover over any date to see the daily count.
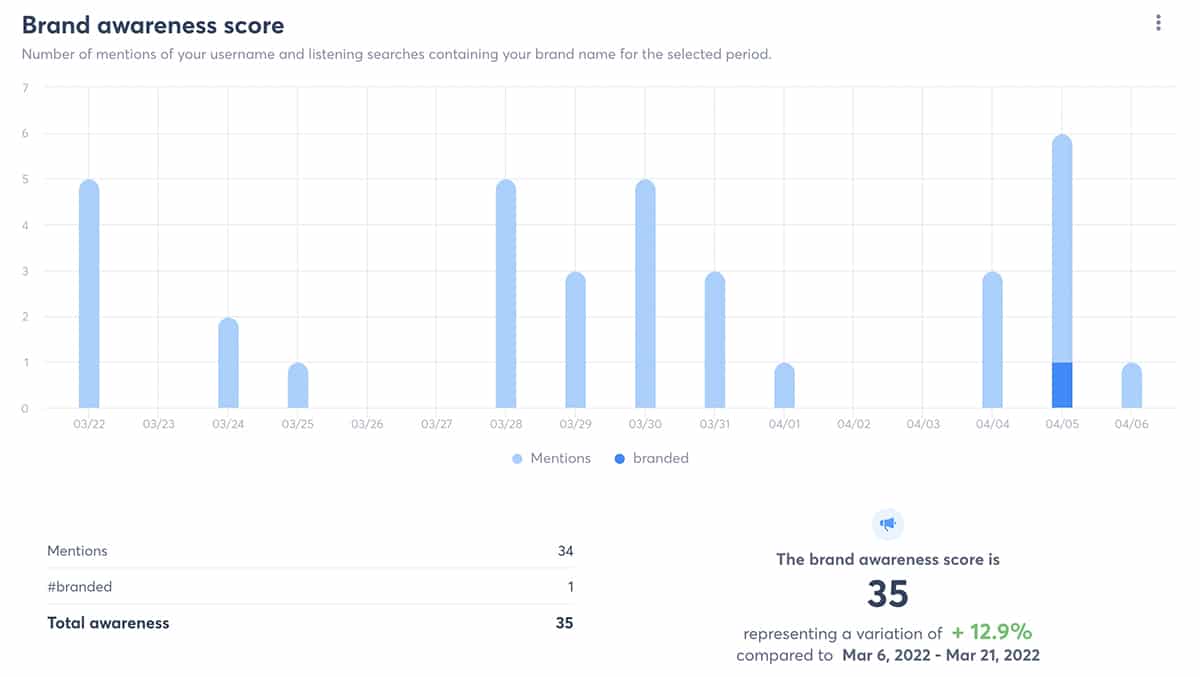
Agorapulse also tracks mentions and branded hashtags. The Brand Awareness Score chart can help you track when users initiate engagement with your brand instead of responding to your content.
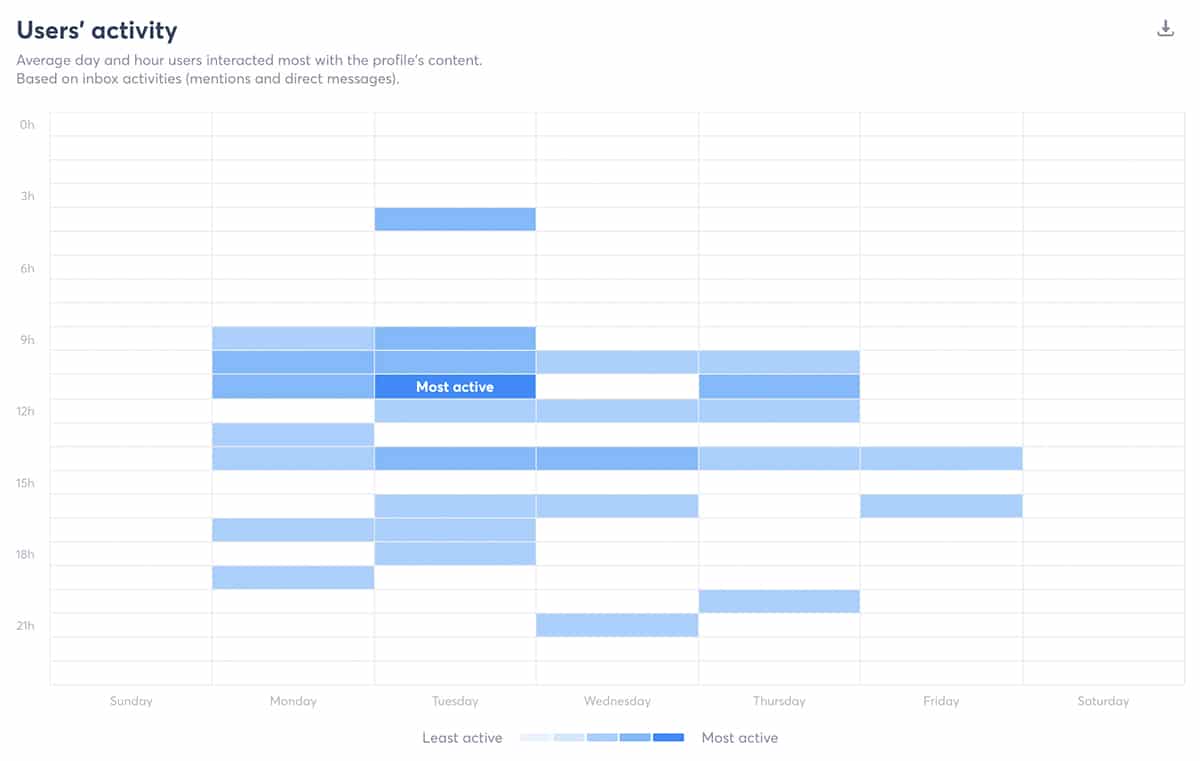
Are you curious about when users are most likely to engage with your profile or your content? Take a look at the Users’ Activity report, which breaks down engagement by hour. You can use these analytics to see when your followers are most likely to mention or DM your brand. To get more engagement, consider publishing content during the most active times.
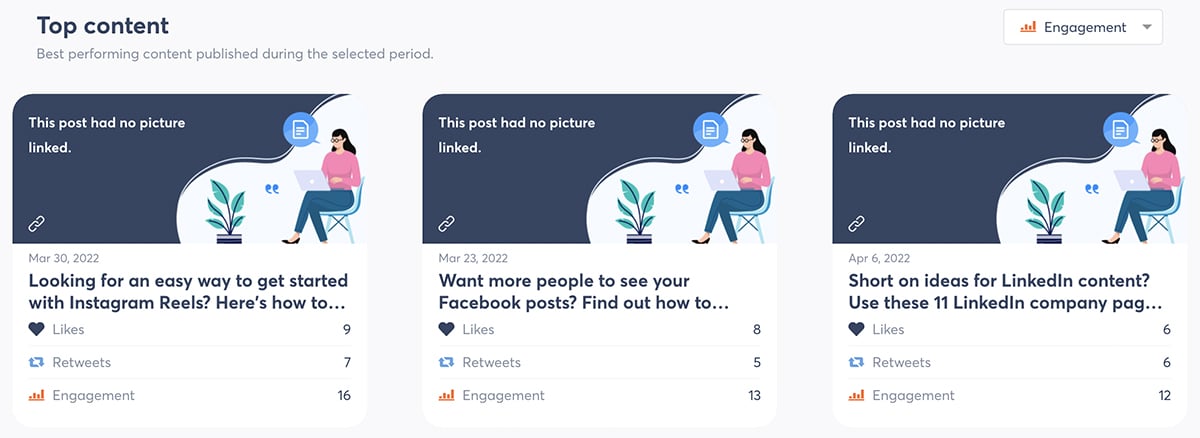
In the Content section of the Reports tab, you can see an engagement breakdown per post. Sort the Top Content chart by Engagement to see the posts that drove the most likes, shares, and comments. You can use these insights to create content that’s more likely to get your audience to interact.
3. Check the social media ROI report
Then go to the ROI tab in your Agorapulse dashboard. Here, you can see how your paid and organic social media campaigns have contributed to website traffic, conversions, and revenue.
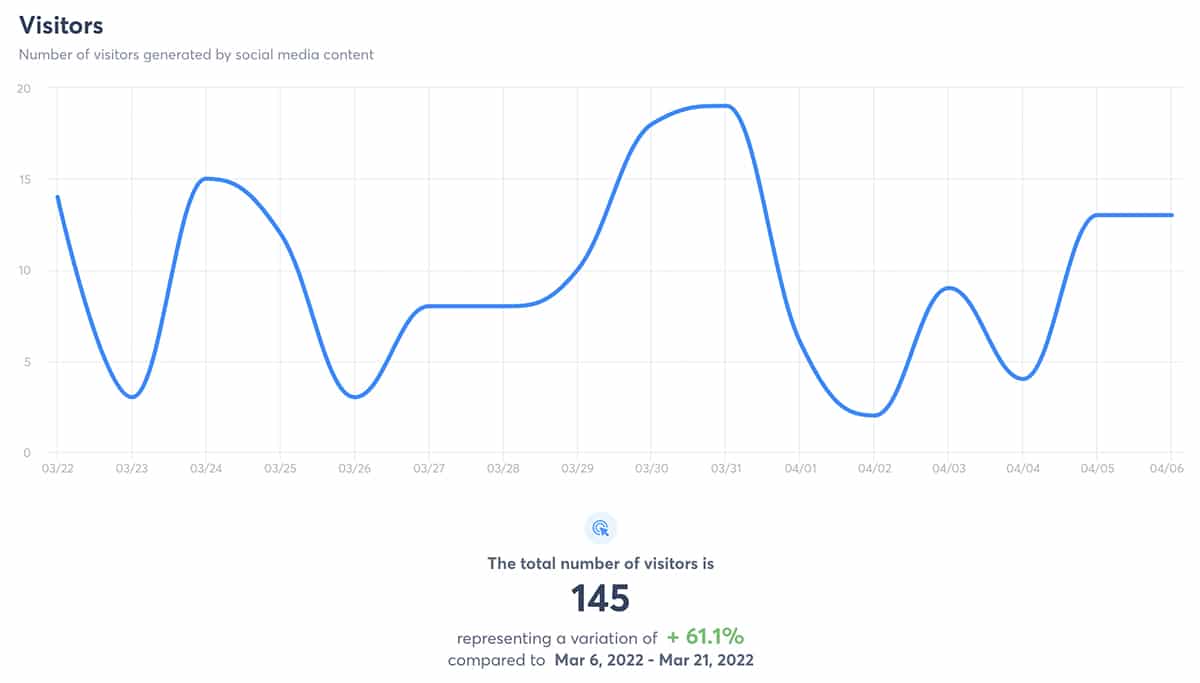
Check the Visitors chart to see how many website visits your social media content has generated and look for patterns throughout the month or week. You can also view the Transactions or Revenue report to calculate the exact value of your marketing efforts.
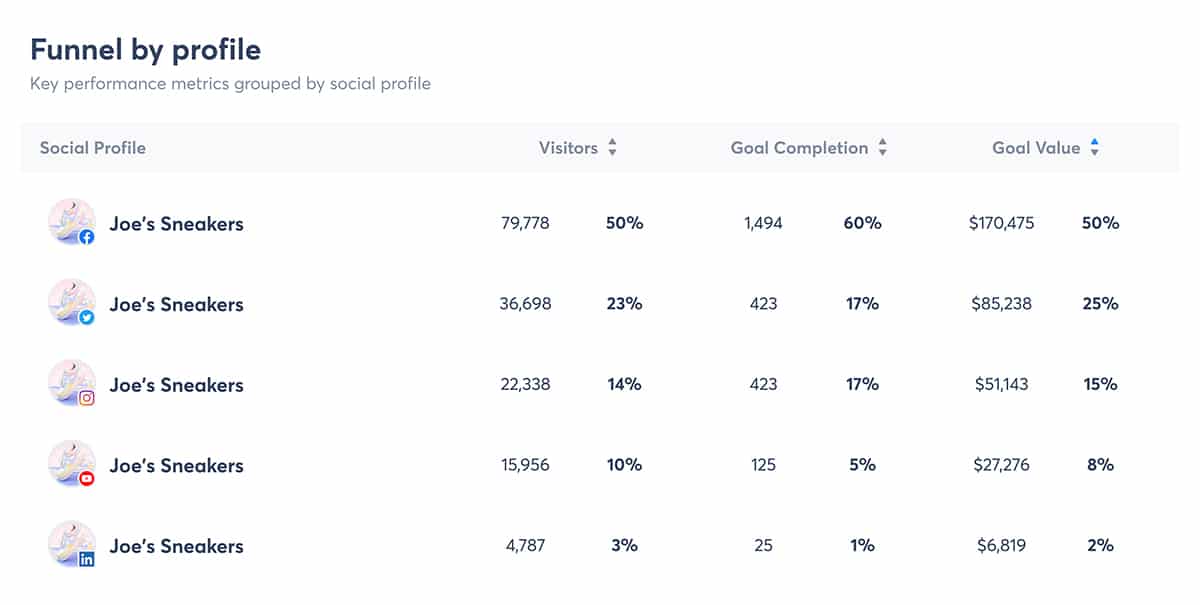
To identify top-performing channels and campaigns, view the Funnel analytics. You can see breakdowns by social media channel and landing page, including visitor, transaction, and revenue data for each.
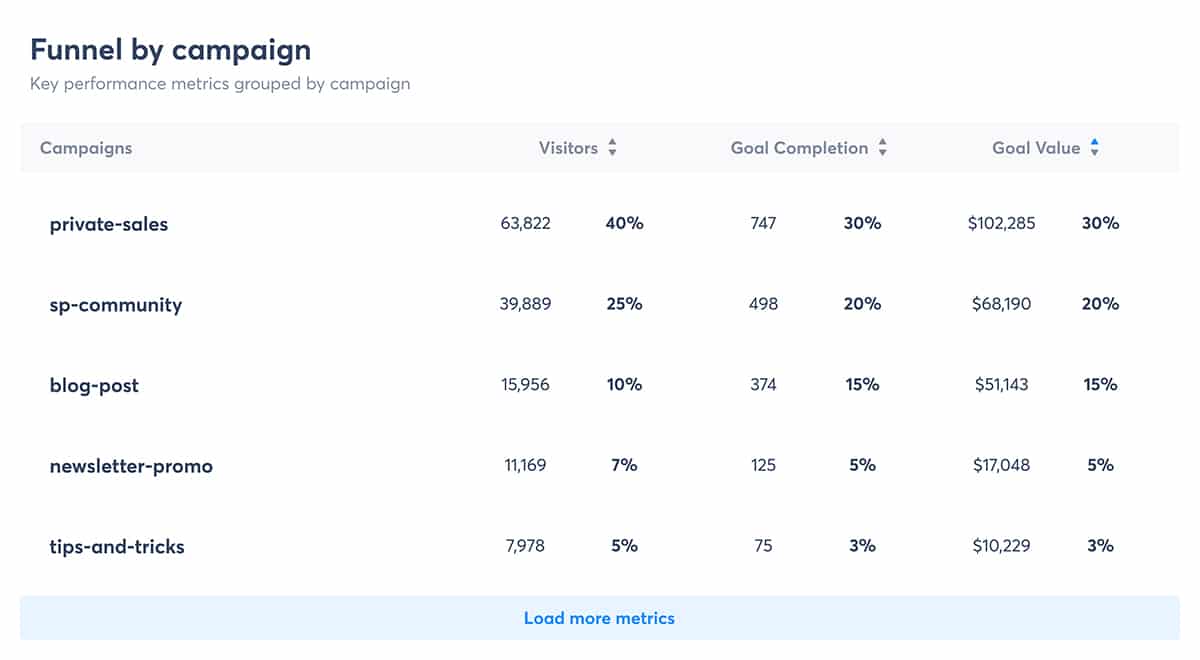
To calculate your social media ROI by campaign, take a look at the Funnel by Campaign chart. If you’ve added UTM parameters to your campaign content, you can easily track engagement and revenue for each paid and organic campaign you run. That way you can find your most successful social media efforts and replicate the most effective elements in future campaigns.
Wrapping Up What We Learned About Engagement Analytics
Engagement analytics can help you understand your audience and make informed decisions about website and social media content. By using both Agorapulse and Google Analytics, you can streamline analytics for your website and social media profiles so you have all the information you need at your fingertips.
Check out our free trial of Agorapulse to help you schedule, track, and measure all your social media efforts.


