

Are your TikTok videos getting the views, interactions, and conversions your company or clients expect? Are you successfully reaching goals? Or maybe your TikTok marketing could use some work.
With TikTok analytics, you can monitor results and make progress toward key goals. You can also use social media analytics to optimize your content and keep your TikTok strategy on track.
Let’s go over everything you need to know about TikTok analytics—including which social media metrics to track, what tools to use, and how to put your analysis to work.
How to Turn on Analytics for TikTok
Accessing TikTok analytics couldn’t be easier. You no longer have to turn on TikTok analytics or switch to a pro account. TikTok provides analytics for both business and personal accounts.
To access analytics for a video, open any published video and tap More Data in the lower right corner.
You also have a few options for accessing account-level analytics:
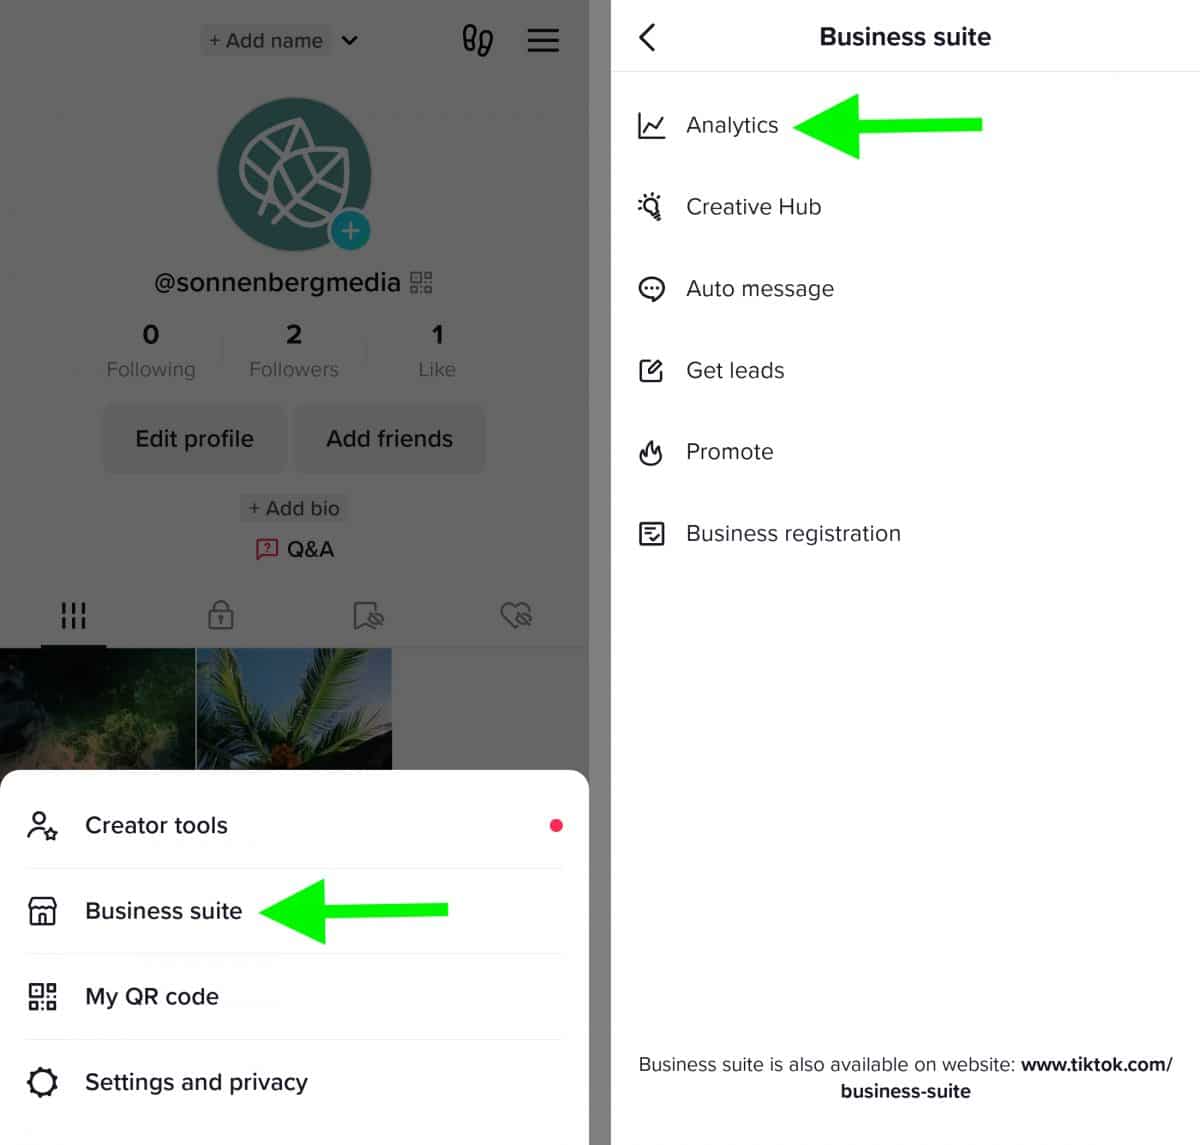
- In the TikTok mobile app, open your account menu and select Business Suite. Then tap Analytics to monitor audience growth and account performance.
- In the TikTok mobile app, open your account menu and select Creator Tools. Then tap Analytics.
- On desktop, log into your TikTok account. Then go to https://tiktok.com/analytics where you can review and download your analytics.
While you don’t need a business account for analytics, TikTok business accounts give you full access to brand- and creator-focused features. So it’s in your team’s best interest to use a business TikTok account.
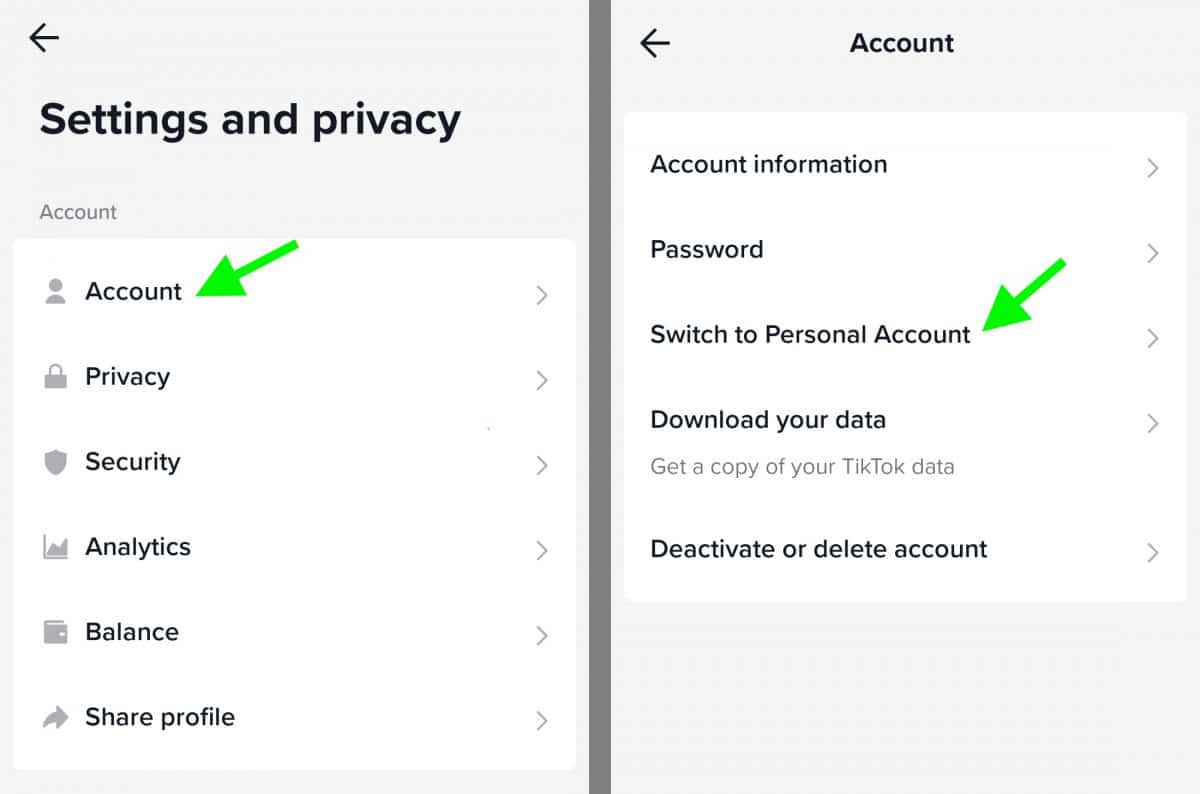
To change your account type, open the Settings and privacy menu for your account and tap Switch to Business Account. (In the screenshot above, the account has already switched to a business account.)
TikTok Analytics: Key Metrics to Monitor
Wondering which TikTok metrics your team should monitor? The answer depends on which goals your team is targeting and what key performance indicators (KPIs) you’ve set.
- Does your company or client want to attract more followers and improve brand awareness? Audience metrics are probably going to be most useful.
- Do you want to educate prospects about your products and get them to consider a purchase? Content metrics are probably going to be the most informative.
- Do you want to drive more sales and generate revenue from your content? Return on investment (ROI) metrics can tell you what you want to know.
Let’s take a closer look at each of these metrics. You may need to toggle back and forth between the mobile app and the desktop version of TikTok’s dashboard to see all the data.
Note that TikTok automatically displays analytics for the last seven days. You can change the time frame to 28 or 60 days or pick a custom time period.
Engagement
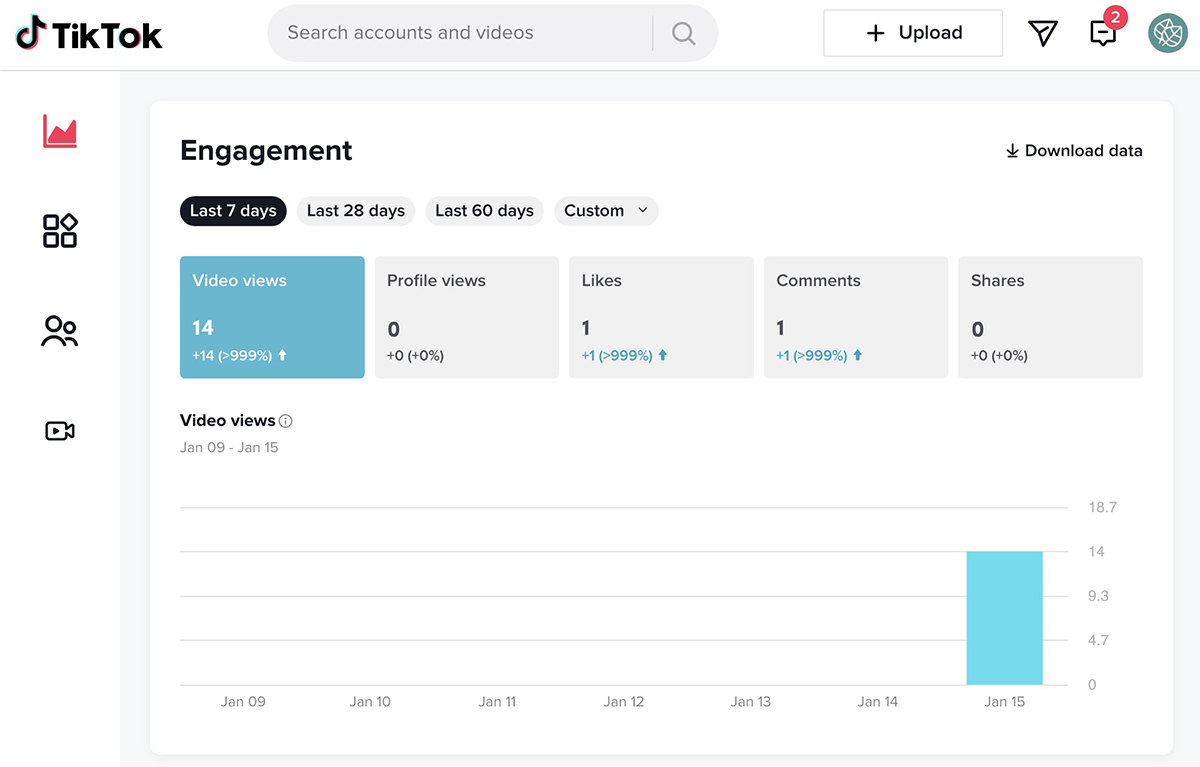
TikTok’s engagement analytics give you a helpful overview of how people are interacting with your recent content across your account. Toggle between the chips to see charts for each engagement metric.
You can chart:
- Video views
- Profile views
- Likes
- Comments
- Shares
Although engagement is often considered a middle-of-funnel metric, not every kind of engagement is considered equal. For example, video views reflect passive engagement, while likes and comments reflect active engagement.
Shares often reflect the highest level of engagement, as they can indicate purchase intent or even endorsement. So while it’s tempting to track all engagement, some may be more relevant than others to your social media goals.
TikTok Followers
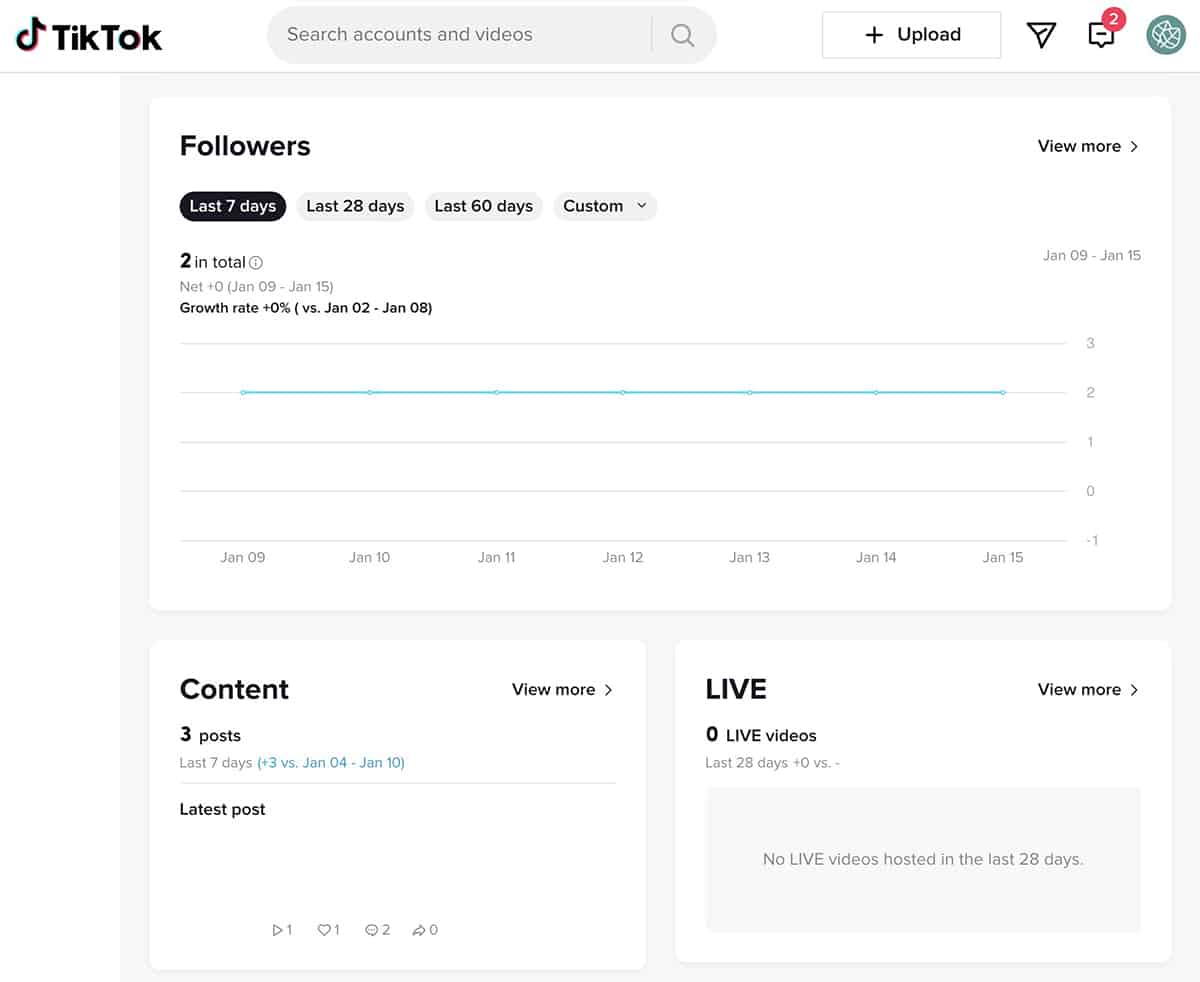
Is your account attracting new followers at the rate you expected? Use TikTok’s audience charts to track growth over time.
In addition to showing your audience variation over time and your total followers, this chart also calculates your growth rate. This percentage is helpful for keeping you on track and ensuring that you continue to grow your audience at a steady rate.
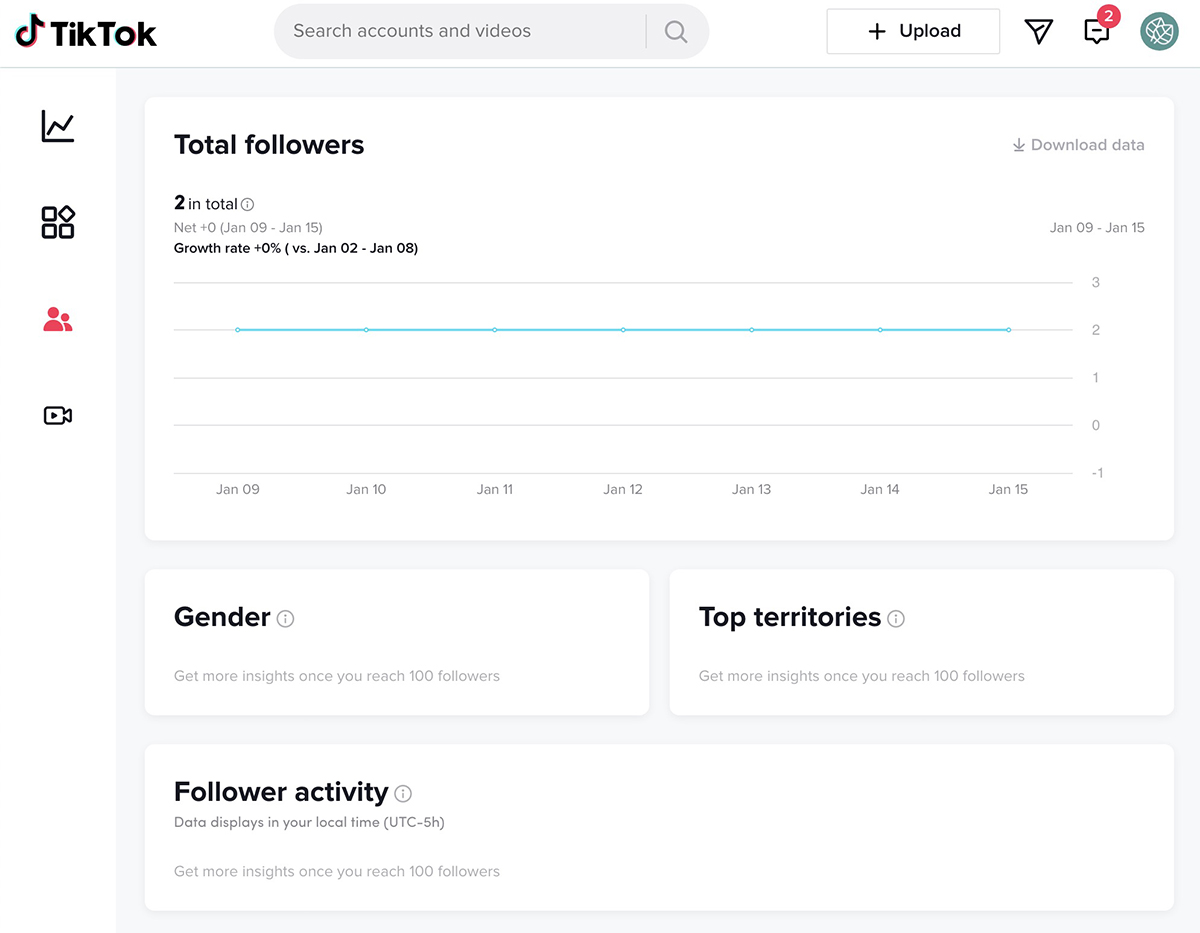
Consistent audience growth is great. But you probably don’t want to attract just any follower. Ideally, you want to draw in your target customer, as they’re most likely to provide value.
To chart your audience demographics, click the View more link in the upper right corner of the followers chart. Note that you can access these metrics when you reach 100 followers.
Then review the gender and territory breakdowns. Do they match up with your ideal customer profile?
If so, that’s a sign that you’re successfully attracting your target audience. If not, you may want to consider some changes to your content plan. We’ll cover next steps below.
TikTok’s follower chart also reveals audience activity. You can use the data to make sure you’re publishing content at the right time.

Content
TikTok’s engagement overview is great for charting activity from week to week and spotting positive or negative trends. But it’s just as important to monitor views and engagement for individual videos.
Want to identify your most popular videos quickly? Go to the Trending videos tab to see which ones generated the most views in the last seven days.
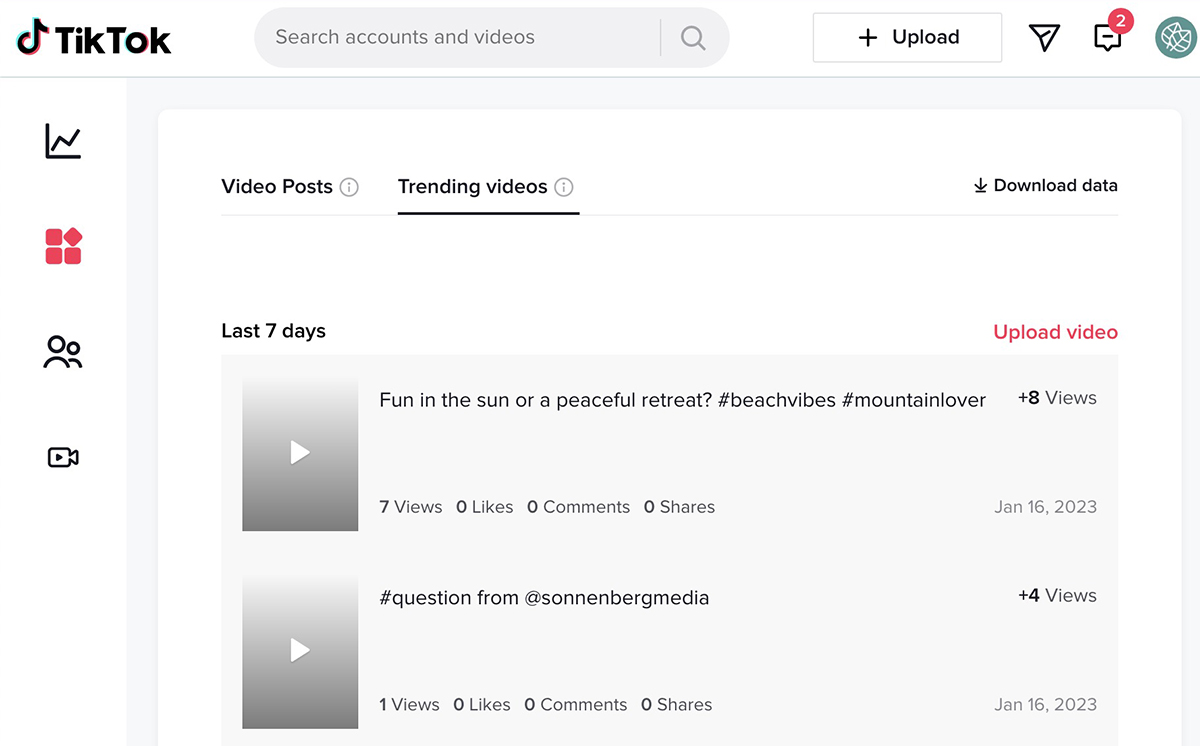
Prefer chronological order? Head back to the Video posts tab to see all your content from the last seven days.
Click to select any video so you can dig deeper into the data. You can see a total tally for key engagement metrics like:
- Video views
- Likes
- Comments
- Shares
- Saves
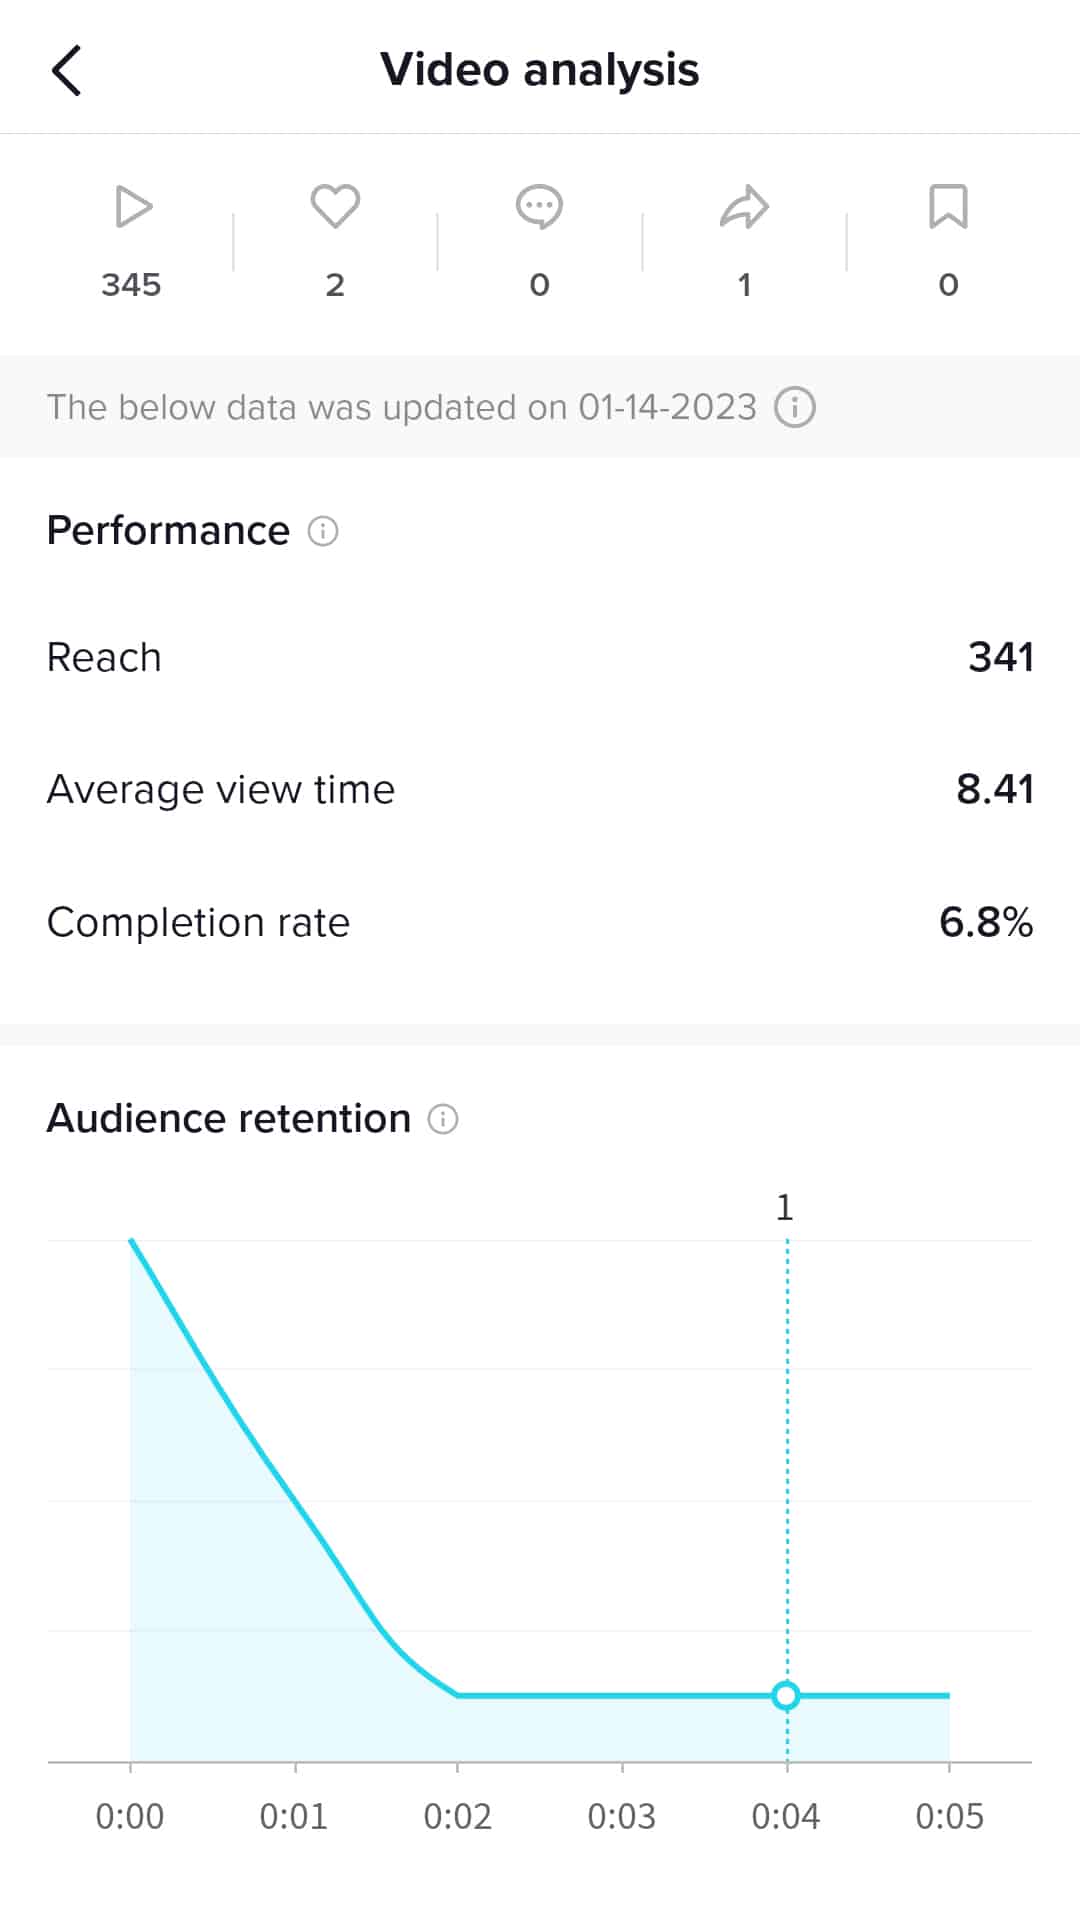
TikTok also provides an overview of each video’s performance. You can see:
- Reach, or the total number of people who saw your video
- Average view time, or the amount of time viewers spent watching the video
- Completion rate, or the percentage of times viewers watched the entire video
Wondering when viewers typically scroll away from your video? The audience retention chart makes it easy to see when most viewers tend to drop off.
Curious how viewers tend to find your content? The traffic source chart gives you a breakdown of where viewers come from. For example, they might find you via the For You Page, TikTok search, or your profile.
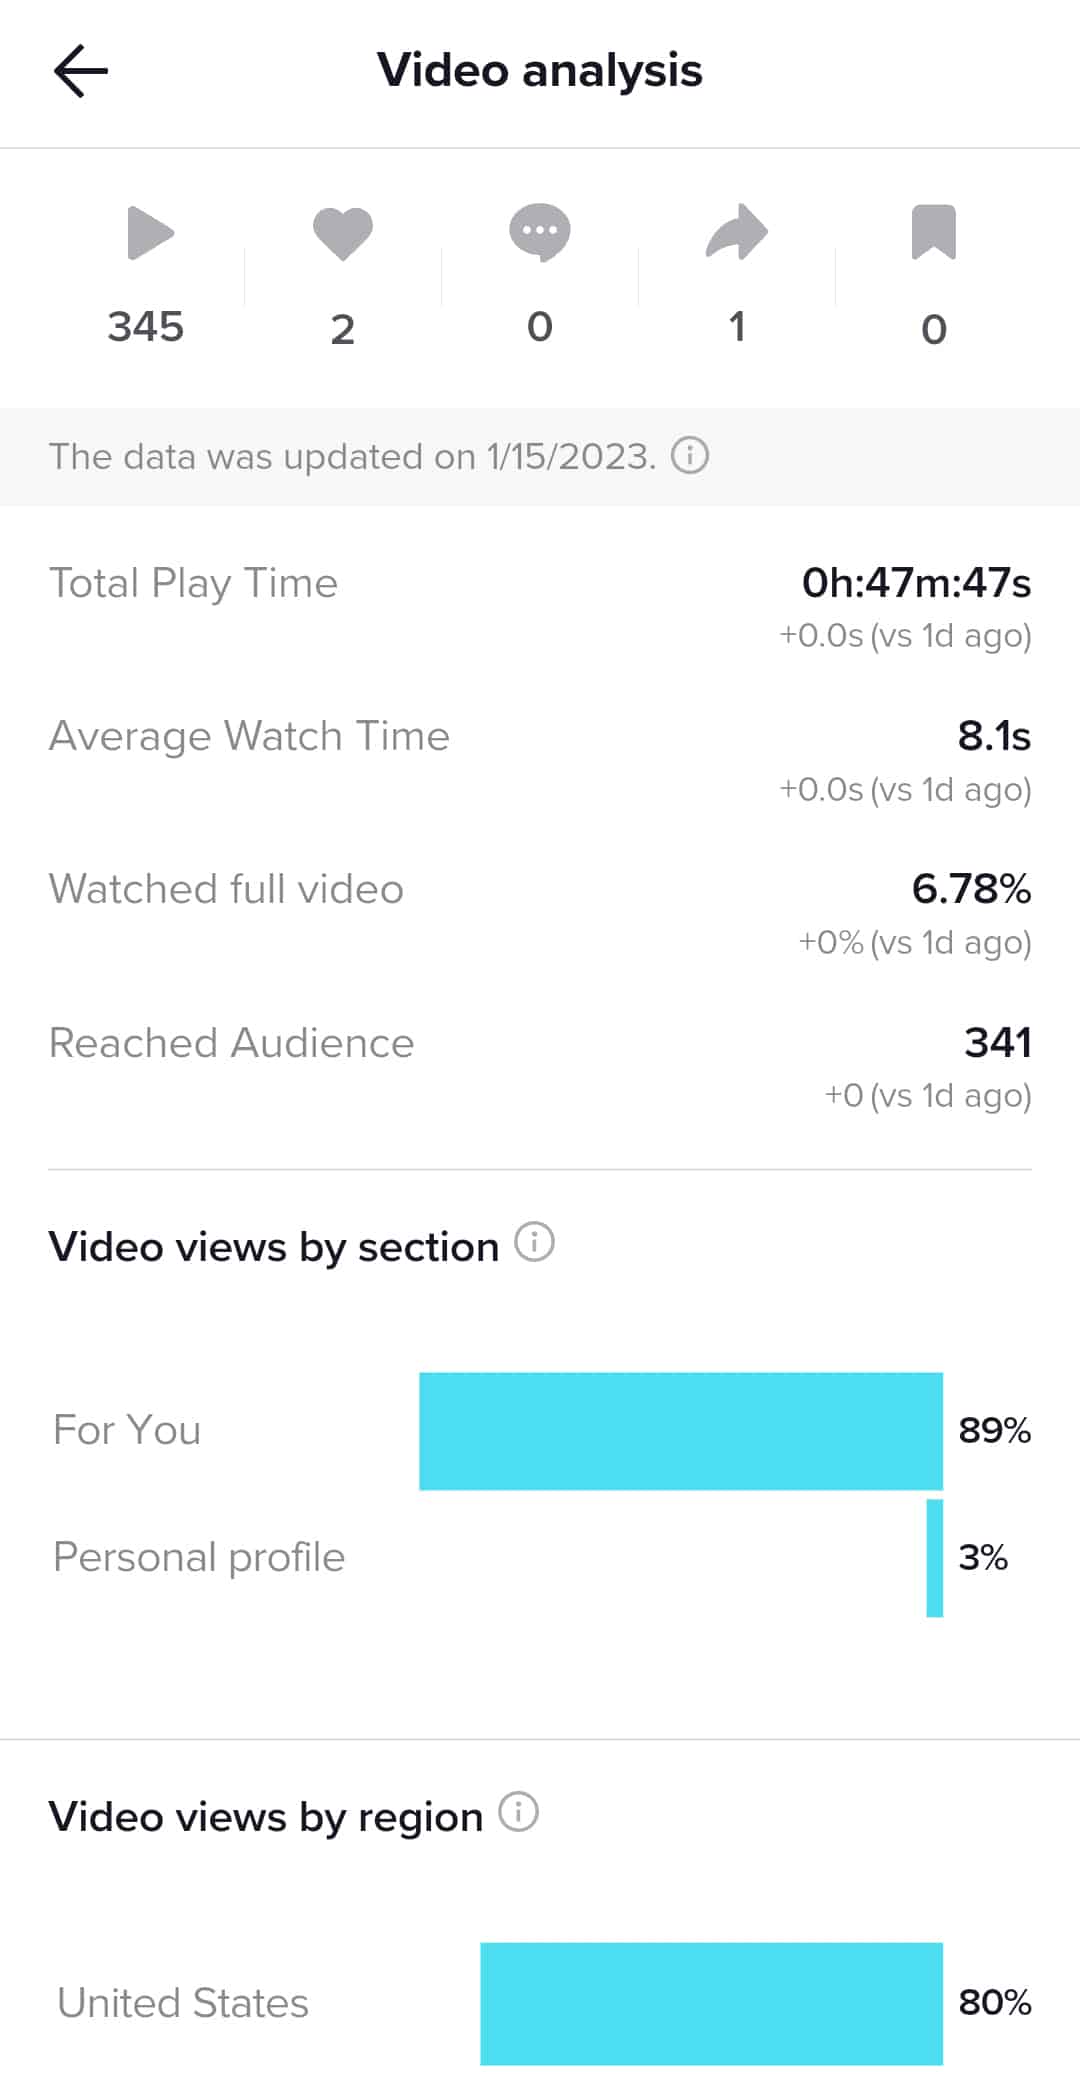
TikTok also provides a breakdown of each video’s viewers. You can see gender, age range, and location—which can help you determine if the right people are watching your videos.
Live
Does your organization use TikTok live? Head over to TikTok’s Live Center to review and download live stream analytics.
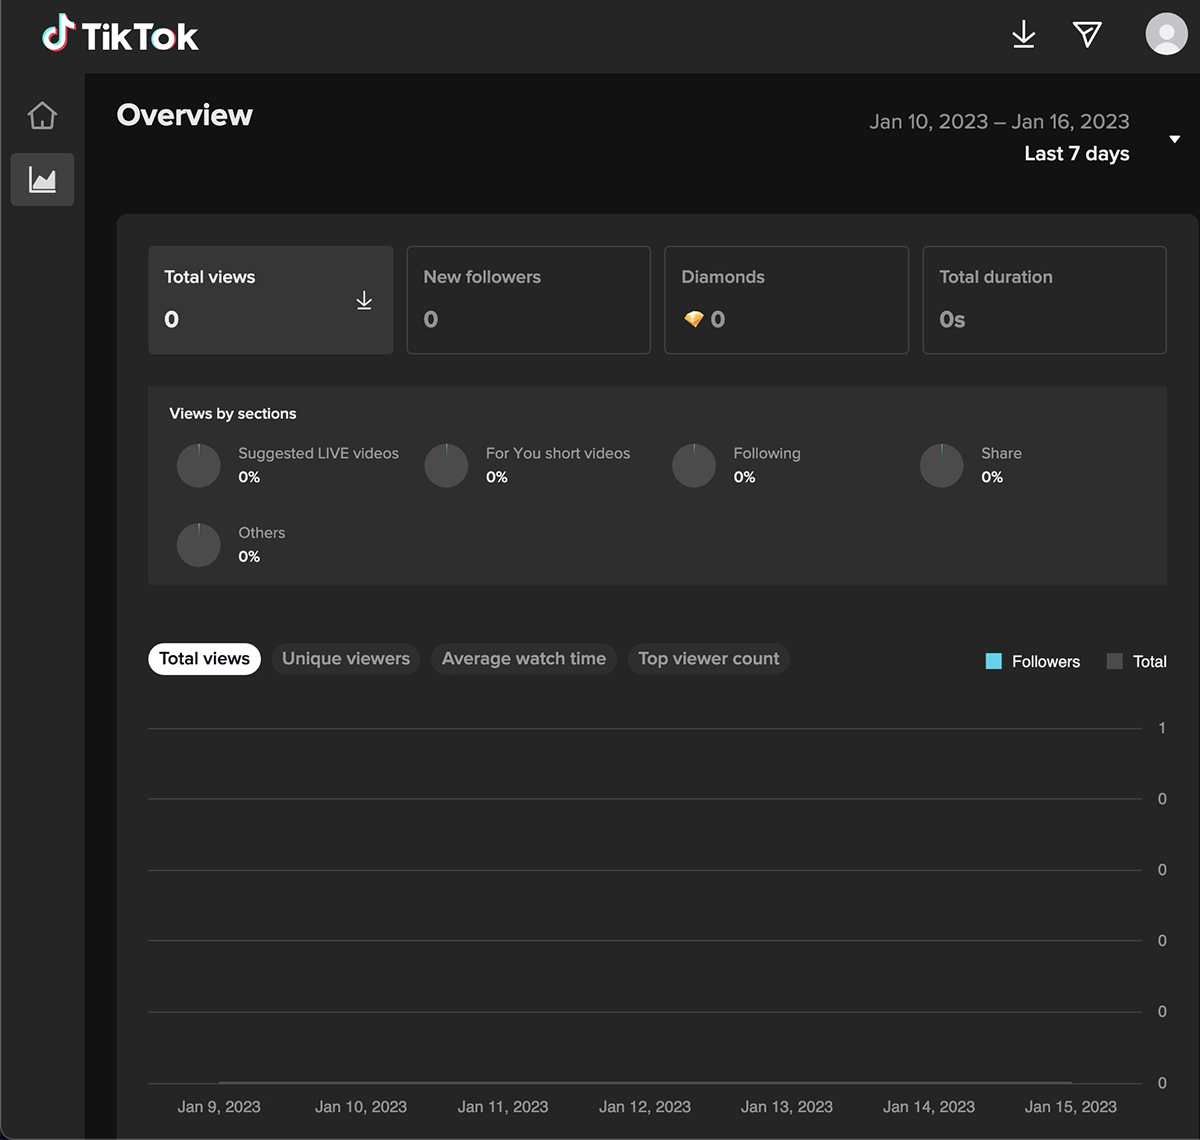
Rather than providing engagement metrics for lives, TikTok focuses on metrics like:
- Views
- New followers
- Diamonds
- Total duration
TikTok’s Live Center also reveals traffic sources so you can pinpoint where your live views come from. Possible sources include:
- Suggested live videos
- For You short videos
- Following
- Share
Want to analyze your views or your viewers? TikTok charts total views, unique viewers, and average watch time over the time period you selected. If your team goes live regularly, these charts are helpful for finding patterns and helping you zero in on what works.
How to Streamline Your Workflow With a TikTok Analytics Tool
As you can see, in-depth analytics are built right into TikTok. So do you really need a TikTok analytics tool in addition to the platform’s native data?
In short, yes—especially if you’re serious about TikTok growth and optimizing value.
Let’s take a look at how Agorapulse’s analytics features can enhance your workflow.
Manage all social analytics with one dashboard
When you manage multiple social media platforms for your company or clients, you can waste a lot of time hopping from tab to tab or checking mobile apps.
With Agorapulse, there’s no need to switch tabs or use a mobile app to check analytics.
Instead, you can track TikTok metrics alongside all the other social profiles you manage—from Facebook and Instagram to LinkedIn and Twitter. Since you can also use Agorapulse to schedule content and respond to engagement, it’s your one-stop shop for TikTok management.
Monitor community management metrics
Although TikTok has plenty of content- and account-level metrics, it’s lacking in a couple of key areas. If community management metrics are important to your team, you’ll need a tool like Agorapulse to track them.
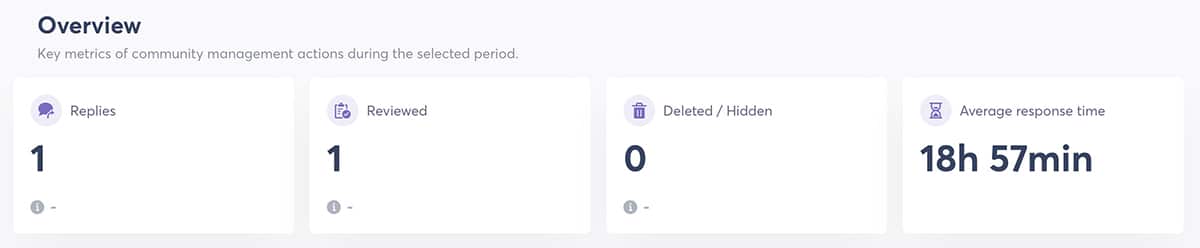
Agorapulse automatically charts the replies you send each day, which is great for pinpointing spikes in activity. The dashboard also tracks your average response time and provides team performance metrics.
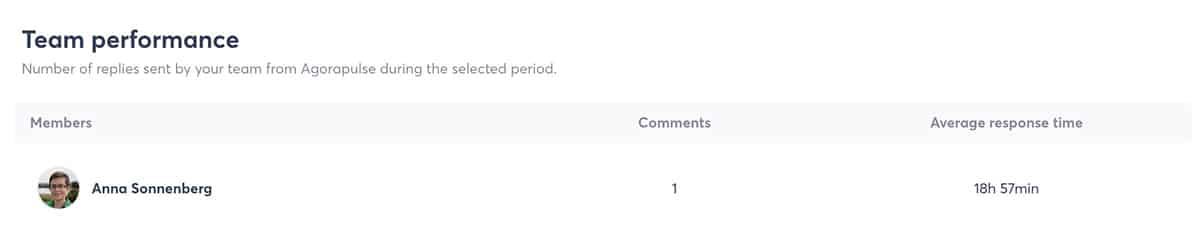
Need to make sure your team is responding within a certain time frame?
Agorapulse breaks down responses by team members, so you can reward top performers or create a plan to help others improve their response time.
Track TikTok return on investment
While followers and engagement might provide value to your brand, these metrics don’t directly equal revenue. If you need to track the revenue that your TikTok audience generates and prove the value of your work, you need TikTok ROI metrics.
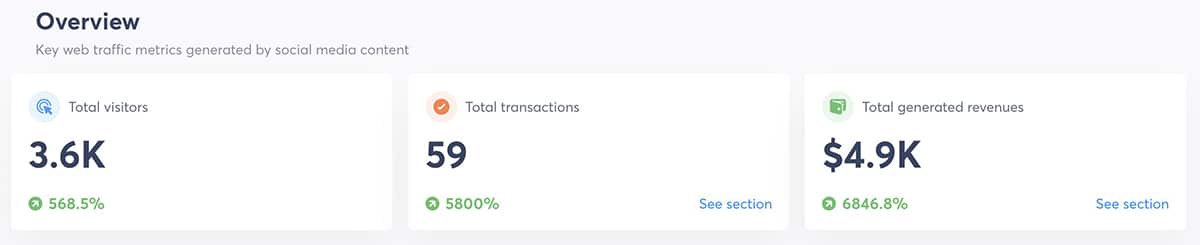
When you connect your website’s Google Analytics account to your Agorapulse dashboard, you can track all the website visitors, transactions, and revenue that your social media efforts generate.
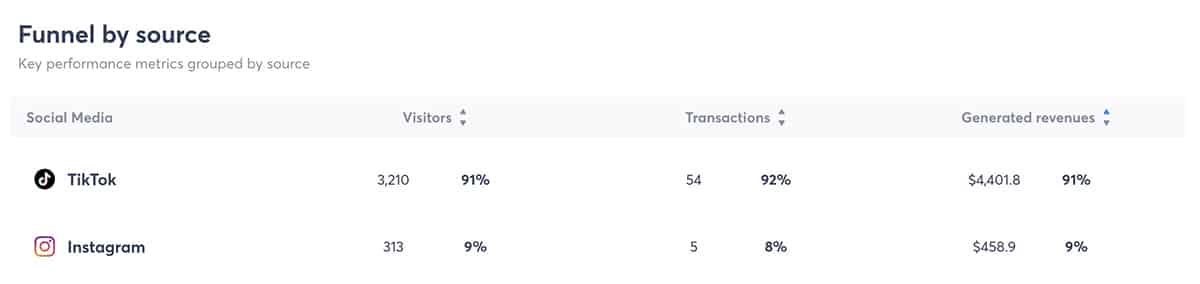
In addition to charting these metrics over time, Agorapulse’s ROI dashboard automatically breaks down results by channel. That means you can track TikTok revenue, and you can also compare it to results from Instagram and other channels.
Create and chart custom analytics
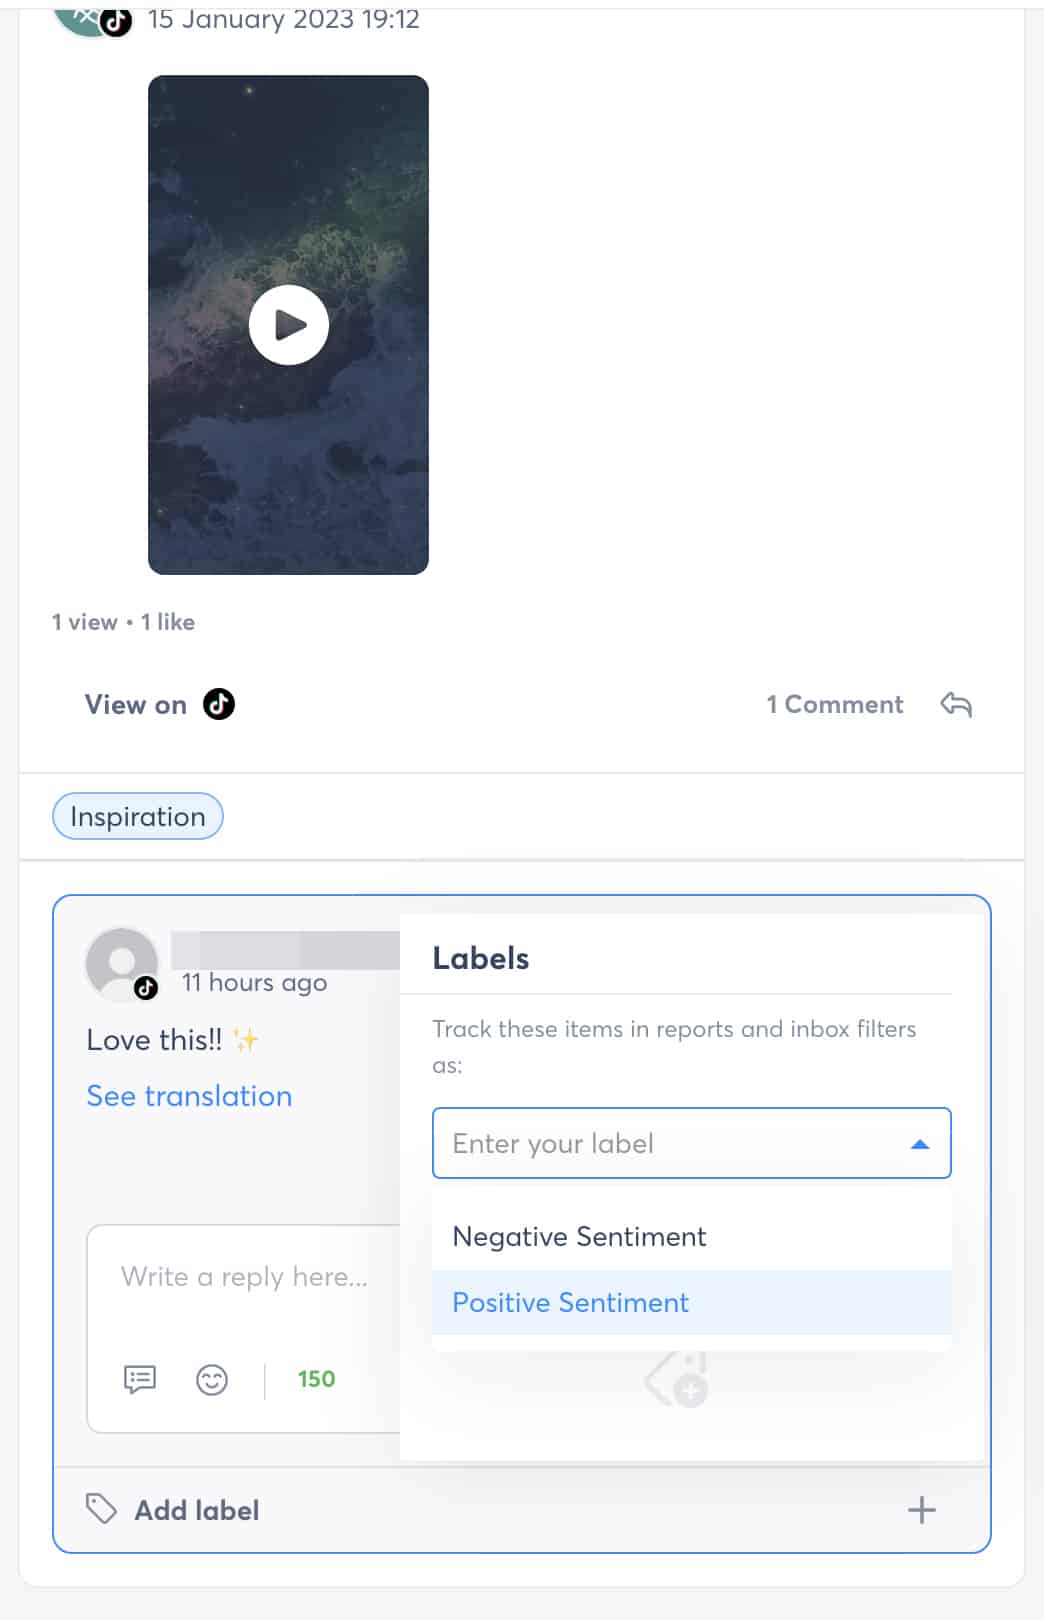
In some cases, Agorapulse’s automated analytics may meet your needs. But you can also track custom analytics, such as publishing and inbox labels, so you can measure sentiment, topics, and other social media metrics.
With these tools, you can track what’s most important to your team. As a result, you can get more from your data and take steps to improve your results.
Prepare visual reports easily and efficiently
One of the biggest downsides to TikTok analytics is that the dashboard doesn’t provide visual reports. If you want to save the charts and graphs you see on your TikTok dashboard, you’ll have to screenshot them and either share the image files or build your own report.
If you opt to export your TikTok analytics, your only option is to download a spreadsheet with raw data. Then you’ll have to add it to your own custom reporting template before sharing the analytics with clients or colleagues.
To create visual TikTok reports, you need a social media dashboard like Agorapulse. Read on to find out how you can export a report with one click or customize your TikTok report for maximum value.
How to Create a TikTok Report
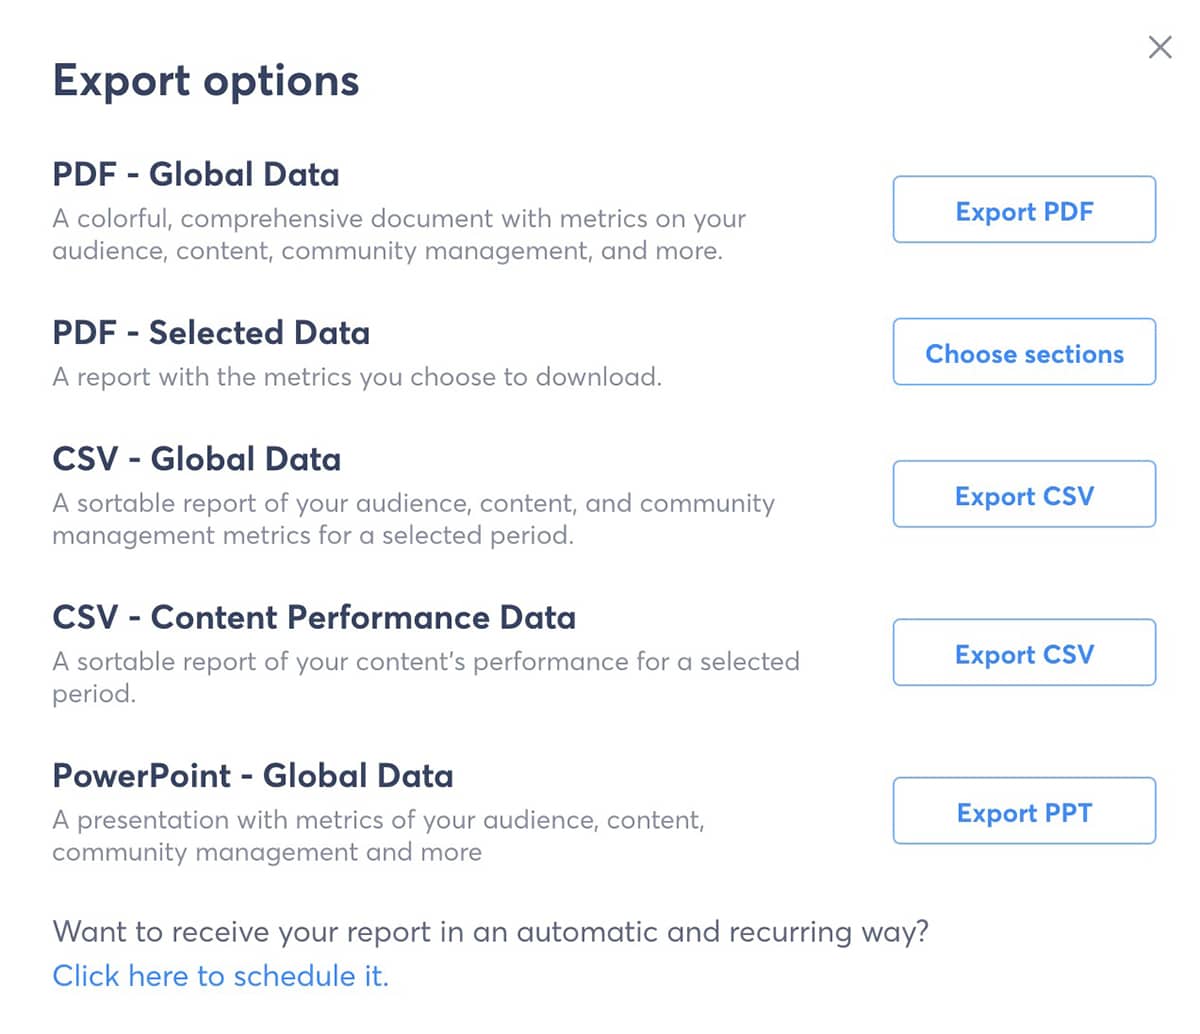
To create a TikTok report with Agorapulse, open the reporting dashboard and select your TikTok profile. Click the Export button in the upper right corner and choose the format you want to download. You can choose from PDF, CSV, or PowerPoint.
Note that you’ll need to download ROI reports separately. From the ROI dashboard, click the Export button. Then check your notifications to download the report.
Downloading a report only takes a minute. But you can save time by scheduling TikTok reports.
From your Agorapulse reporting dashboard, click the Schedule Reports button in the upper right corner. Then choose the report frequency and settings that best meet your needs.
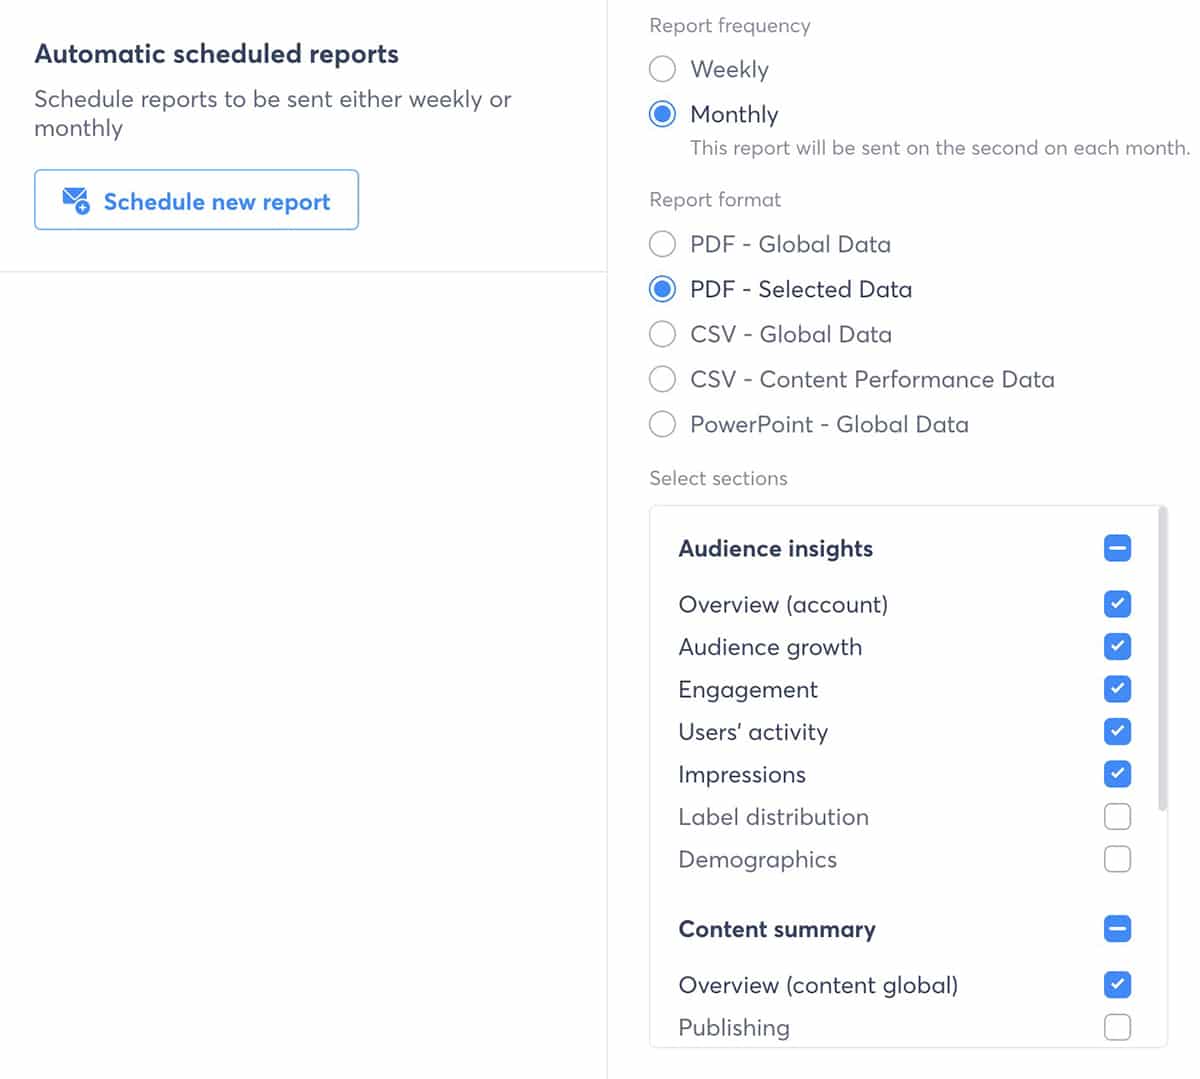
You can select the exact sections you want in your report. No more wasting time on data that doesn’t align with your team’s goals. You can also copy internal and external recipients on the report.
Want to review the report and add your own insights before sharing it with your team? Schedule the report to land in your inbox only so you can review it first.
How to Optimize Your TikTok Strategy Using Analytics
Once you’ve turned your TikTok analytics into a report, it’s time to put the information to work. With those ideas, you can turn your analytics into actionable tactics and improve your TikTok marketing strategy.
Recreate top-performing videos
First, identify your top-performing videos based on the metric that’s most important to your team. Using Agorapulse’s TikTok content report, you can sort top content by social media metrics like video completion rate, video replays, and engagement.
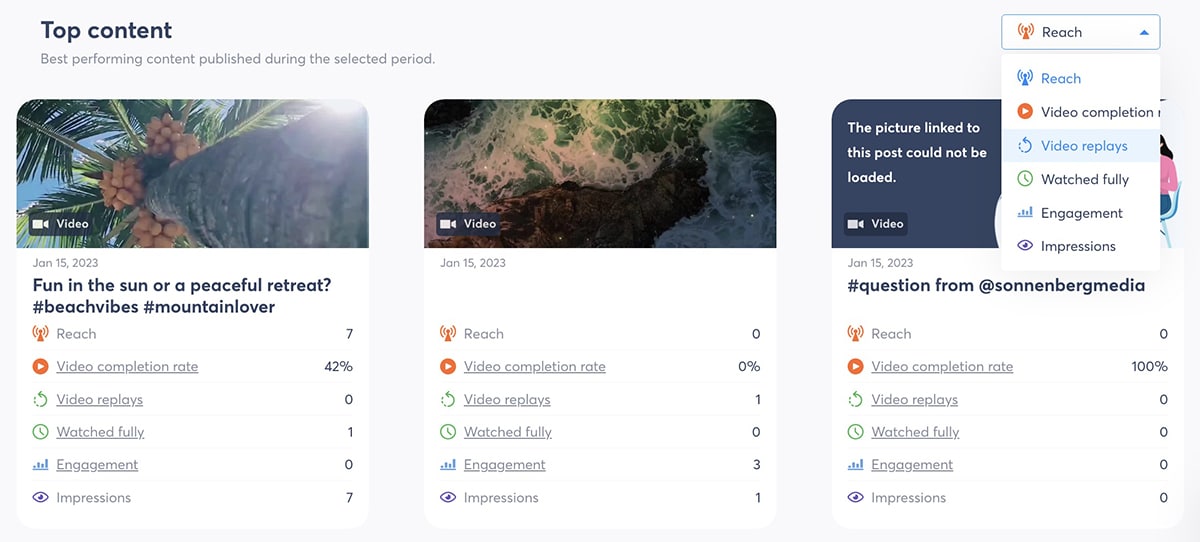
Then pinpoint some of the characteristics they have in common. Do they use similar TikTok filters or transitions? Are they similar lengths—and are they under a minute or closer to 10 minutes? Use your insights to plan more content and test your theories.
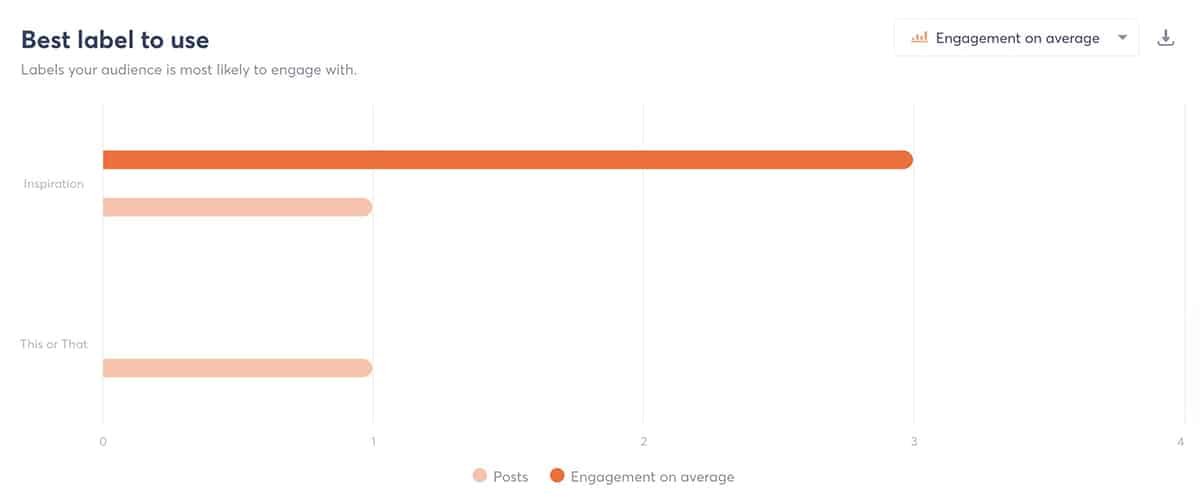
Find the right topics for your audience
If you use Agorapulse’s publishing labels, you can easily see which topics perform best with your audience. Did they engage more with a particular campaign? Do they tend to rewatch behind-the-scenes videos multiple times? Did a certain trend generate tons of views?
Keep these insights in mind as you attempt to recreate your top-performing videos. While it probably won’t make sense to repeat a specific campaign, you can repurpose topics and trends when you make new TikTok videos.
Target your ideal customers
Technically, the TikTok videos that generated the most views or engagement are your top-performing content. But if TikTok delivered these videos outside of your target audience, they may not truly represent your most effective content.
Focus on the videos whose demographics best align with your ideal viewers. Make note of their topic and style. Then review the video’s hashtags and analyze the comments. Figure out exactly what resonated so well with your audience so you can recreate it.
Improve customer sentiment
A little negativity isn’t always a bad thing, especially if you create content that often elicits strong reactions. But in most cases, you’ll probably want viewers to have reactions that err more on the positive side.
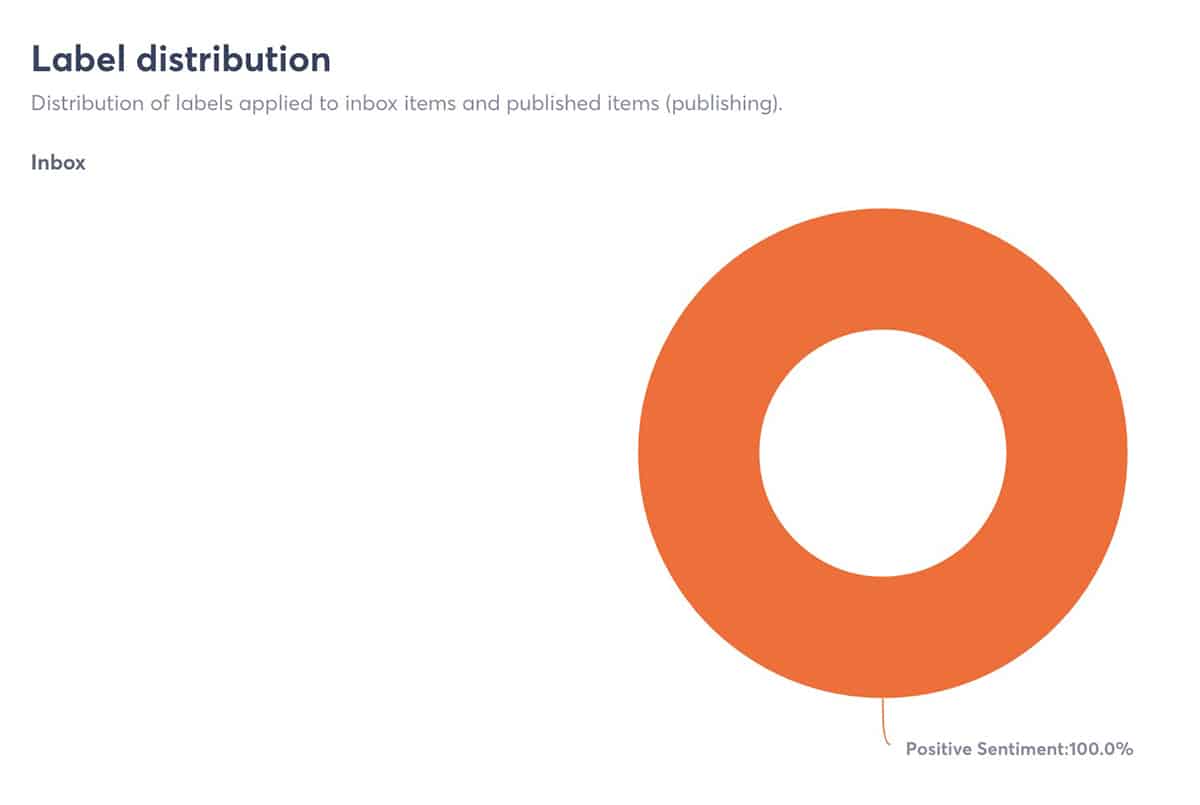
As you plan new TikTok content for your company or clients, review videos that generated the most positive engagement. Likes and shares only tell part of the story, but Agorapulse’s inbox labels make it easier to tag and monitor the sentiment of TikTok comments.
Publish at the ideal times
Topics, styles, and interactive features are just some of the elements that can affect video performance. If you want to get more views on TikTok, publish content at the right time.
With your report’s recommendations, you can easily improve your publishing schedule. By posting videos or going live at the ideal time for your audience, you’ll have a better chance of getting views and engagement right away—which can improve overall performance.
Engage more effectively
Engagement is essential for building a community on TikTok. And it’s important to remember that engagement goes both ways.
Does your team tend to respond to comments efficiently? Or is your average response time several hours or days?
Use your analytics to pinpoint issues with delayed replies. Then make a plan to decrease your response time and make more successful connections with viewers.
Wrapping Up What We Learned About TikTok Analytics
TikTok analytics are the key to optimizing the results and the value your organization gets from this social network. While the app’s native analytics are a good starting point, an all-in-one social media solution like Agorapulse lets you dig deeper into your TikTok analytics so you can continue to learn and improve.
Sign up now for a free demo and find out how Agorapulse can help you dig into social media analytics and much more!

")

